

Translate this page into:
Synthesis and Optical Performance of terbium complexes with octanoyl amino acids
⁎Corresponding author. naren88@hotmail.com (Naren Gerile)
-
Received: ,
Accepted: ,
This article was originally published by Elsevier and was migrated to Scientific Scholar after the change of Publisher.
Abstract
Abstract
As multifunctional materials, amino acid rare-earth compounds exhibit unique physical and chemical properties. Considering their wide applications, we synthesized a new type of amino acid terbium complexes, which exhibit interesting optical properties. Three novel octanoyl amino acid terbium complexes were synthesized and investigated in this study: terbium octanoyl-alaninate (Tb(oct-ala)3·H2O), terbium (III) octanoyl-phenylalaninate (Tb(oct-phe)3·H2O), and terbium (III) octanyl-serinate (Tb(oct-ser)3·3H2O). The molecular structure and surface morphology of these three complexes were studied using various methods, including 1H (Nuclear Magnetic Resonance) NMR, Fourier-Transform Infrared Spectroscopy (FT-IR), powder X-Ray Diffraction (XRD), and Scanning Electron Microscope (SEM). The XRD results show that Tb(oct-phe)3·H2O and Tb(oct-ser)3·3H2O present long-range disorder and short-range order, while Tb(oct-ala)3·H2O shows long-range disorder and short-range disorder. SEM results revealed irregular shapes of the samples synthesized. Polarizing Microscopy (PM) observations show that Tb(oct-phe)3·H2O and Tb(oct-ser)3·3H2O samples are optically anisotropic at and above the room temperature. Tb(oct-ala)3·H2O exhibits optical homogeneity over the investigated temperature range. Also, the optical properties of complexes were examined using Ultraviolet–Visible Spectroscopy (UV–Vis), Emission Spectroscopy, Fluorescence Lifetime, and Quantum Yields (QY). The UV–Vis absorption spectra show that the complexes have excellent absorption properties in the UV region, and the absorption range of the complexes (200–400 nm) is larger than that of the ligands (200–270 nm). After irradiation with a 254 nm UV lamp, these three complexes are bright green in both solution and solid form. For the emission spectra, the luminescent intensity of the three complexes increases with an increase in concentration. Comparing the fluorescence spectra of the three powders, we observed that Tb(oct-phe)3·H2O has stronger luminescent intensity, longer fluorescence lifetime and larger quantum yield than the other two complexes. The structure of these terbium complexes was investigated using Density-Functional Theory (DFT) calculations and combining theory with experiment.
Keywords
Octanoyl amino acid
Terbium complexes
UV–Vis absorption
Luminescent properties
Density-Functional Theory

1 Introduction
An amino acid is a kind of biological ligand (Naren, 2008). It is the basic structural unit of proteins and enzymes (Hirose et al., 2019; Renes et al., 2019). Rare-earth elements have been widely used in many fields such as fluorescent materials, electric light source materials, permanent magnet materials, hydrogen storage materials, catalytic materials, magnetic refrigeration materials, and magnetostrictive materials (Yang et al., 2007; Wang et al., 2007). In the mid-1960s, Levin and Pelican showed that rare-earth europium complexes could be used as one of the three primary colors of color TV (Ji et al., 2008). Luminescent materials based on lanthanide ions have been widely applied in the fields of sensing, bio-imaging, printing, and writing (Zhang et al., 2019; Lustig et al., 2017; Hu et al., 2011; Xia et al., 2017; Weng et al., 2018). Rare-earth amino acid complexes can transfer energy from organic ligands to rare-earth ions in the center of rare-earth complexes under ultraviolet irradiation. The electronic structure and bonding characteristics of rare-earth ions (Eu3+, Tb3+, etc.) have the advantage of large Stokes shifts, narrow line-like emission, high luminescent efficiency, long lifetimes, high coordination number, and changeable binding (Han et al., 2017; Bunzli, 2017; Chen et al., 2017). Therefore, we believe that the interaction between low luminescence rare-earth ions and the amino acid organic ligands leads to an Antenna effect and significantly improves the light absorption and luminescence of the complexes (Naren, 2008).
In this study, terbium complexes of three octanoyl amino acids were prepared based on the combination of terbium chloride with three octanoyl amino acid ligands. The structure and optical properties of the complexes synthesized were explored. Our results show that these rare-earth amino acid complexes are new organic matrix environmental-friendly materials with excellent physical and chemical properties, indicating that these rare-earth ions/amino acid complexes could be potentially applied to organic light-emitting materials, polishing powder, special luminescent materials, etc.
2 Experimental
2.1 Preparation of the rare-earth amino acids
TbCl3·7H2O (≧99.9%) and three amino acids (≧98%), alaninate, phenylalaninate, and serinate, were purchased from Aladdin Industrial Corporation. CH3OH (≧99.5%), CH3CH2OH (≧99.7%), NaOH (≧96%), H2SO4 (≧98%), (CH3CH2)2O (≧99.5%), and CH3COCH3 (≧99.5%) were purchased from China Zhiyuan Chemical Reagent Co., Ltd, Tianjin. All aqueous solutions were prepared using Milli-Q water.
Three octanoyl amino acid ligands and the new octanoyl amino acid terbium complexes were synthesized according to similar methods as referenced (Bert et al., 1999).
The synthesis process of ligands is as follows: a 5 M sodium hydroxide solution was first dripped into an aqueous solution of alanine to adjust the pH value of the solution. When the pH of the solution became stable, Octanoyl chloride was slowly dripped into the solution to obtain a pH of 10. After 12 h of reaction, then sulfuric acid was added dropwise to reach a constant pH value of 4. Finally, purification was carried out using n-hexane and petroleum ether solvent to obtain the octanoyl amino acid ligands.
To synthesize the octanoyl amino acid terbium complexes, 3 mol of synthetic octanoyl amino acid was dissolved in 80 mL methanol and 0.89 M potassium hydroxide solution was added to adjust the pH value of 10. Then 1 mol of terbium chloride was added to the solution for 12 h of reaction. After purifying the product with ethanol and acetone, a white powder was obtained. The water content of the rare-earth complexes was determined by Karl Fischer titration.
2.2 Characterization of the rare-earth amino acid complexes
1H NMR analysis of the complexes was performed using a BRUKER NMR 600 (600MHZ) spectrogram at ambient temperature in dimethylsulfoxide (DMSO). FT-IR spectra were obtained using the KBr pellet technique on the PerkinElmer Spectrum Two. The spectrum range is 400–4000 cm−1, and the functional group information of the complexes was obtained by analyzing the spectrum.
In order to verify the long-range and short-range ordered/disordered structure information of the complexes, a Philips PW-1830 X-ray diffractometer (Cu-kα, λ = 0.154184 nm) was used to measure the complexes by wide-angle X-ray diffraction at room temperature, and the range of measurement was 6–80°. A Rigaku Ultima IV X-ray diffractometer was used for small-angle X-ray measurement, and the measurement range was 0.5–6°.
The microstructures of the complexes were observed using a Hitachi S-3400N scanning electron microscope. Polarizing microscopy was carried out using an OLYMPUS CX31 polarizing microscope. UV–Vis absorption spectra were obtained using a Lambda 35 UV–Vis Spectrometer (Perkin Elmer). The emission wavelength and fluorescence lifetime of the complex were detected using an EX-1000 fluorescence spectrometer with an excitation wavelength of 268 nm.
2.3 Computational details of the rare-earth amino acids
The results of 1H NMR, elemental analysis, and FT-IR analysis were used as the PBE1PBE/gen method in DFT to determine the structure of complexes (Frisch et al., 2013). The four elements, C, O, N and H, belong to a 6-31g* group, and the central element Tb is in the MWB54 group.
2.4 Preparation of the LED devices with terbium complexes
The LED devices are made of terbium complexes powder mixed with encapsulated transparent silica gel and added to the chip. The chip is a 365 nm near-ultraviolet chip. The packaged chip is put into the oven to dry at about 60 °C. After drying, connect the LED device to the power supply, and observing its luminescent properties.
3 Results and discussion
3.1 1H NMR and elemental analysis
The content ratio of hydrogen atoms bound by various functional groups in Tb(oct-ala)3·H2O, Tb(oct-phe)3·H2O and Tb(oct-ser)3·3H2O were examined using 1H NMR. The NMR results show that the chemical shifts of the ligands observed for H(oct-ala) (Fig. 1 (a)) include δ 12.24 (s, 1H), 8.05 (d, J = 7.3 Hz, 1H), 4.23–4.10 (m, 1H), 2.20–2.05 (m, 2H), 1.52–1.42 (m, 3H), 1.24 (d, J = 7.2 Hz, 10H), and 0.88–0.84 (m, 3H). The chemical shift of 1.52–1.42 (m, 3H) corresponds to the —CH3 peak on the side chain. The chemical shifts of H(oct-phe) (Fig. 1 (c)) obtained were δ 12.40 (s, 1H), 8.08 (d, J = 8.2 Hz, 1H), 7.28–7.17(m, 6H), 4.44–4.39 (m, 1H), 3.07–3.02 (m, 1H), 2.85–2.80 (m, 1H), 2.30–1.90 (m, 3H), 1.52–1.34 (m, 3H), 1.20–1.17 (m, J = 7.3, 3.6 Hz, 4H), and 0.87–0.84 (m, 4H). The peak at δ 7.28–7.17 is the characteristic peak of a benzene ring. For H(oct-ser) (Fig. 1 (e)), the following chemical shifts were obtained: δ = 12.47 (s, 1H), 7.94 (d, J = 7.9, 1H), 4.95 (s, 1H), 4.30–4.24 (m, 1H), 3.64 (m, 2H), 2.14 (m, 2H), 1.49 (m, 2H), 1.26 (m, 8H), 0.86 (m, 3H). Fig. 1 shows the 1H NMR spectra of the rare-earth complexes (Fig. 1 b, d, f). The chemical shift differences of the rare-earth complexes relative to those of the ligands are significant. The paramagnetic properties of terbium induce the chemical shifts to lower fields (Zhang, 2009). Therefore, 1H NMR cannot accurately determine the hydrogen content in the rare-earth complexes. Further elemental analysis needs to be carried out.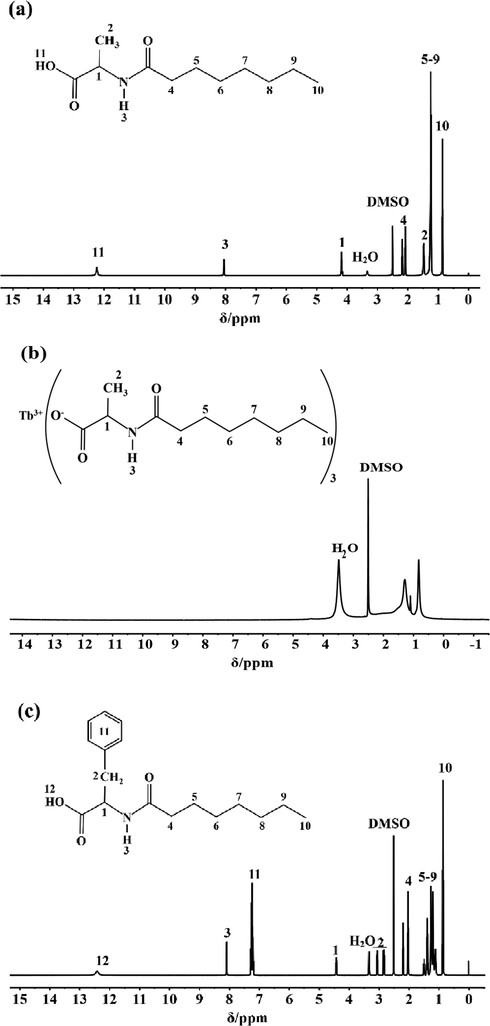
1H NMR Spectra: (a) H(oct-ala), (b) Tb(oct-ala)3·H2O, (c) H(oct-phe)·H2O, (d) Tb(oct-phe)3·H2O, (e) H(oct-ser), (f) Tb(oct-ser)3·3H2O.
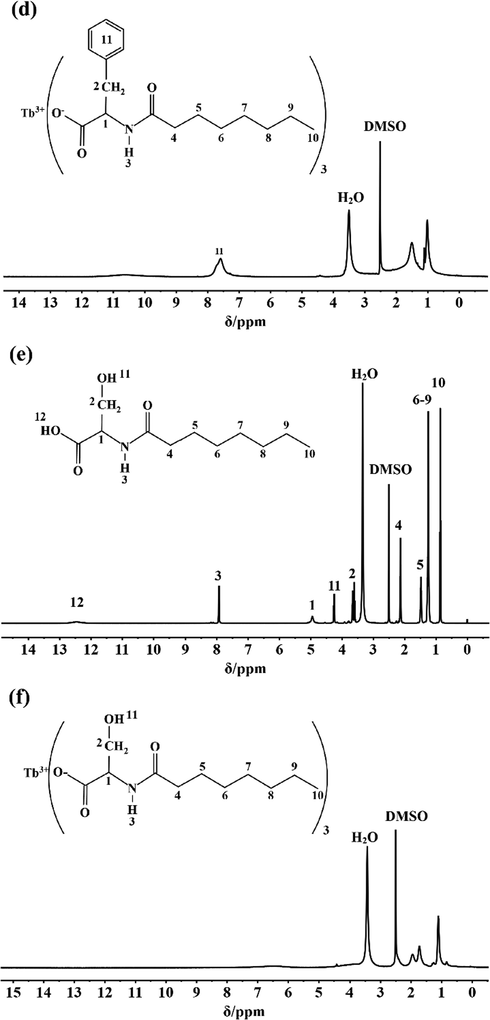
1H NMR Spectra: (a) H(oct-ala), (b) Tb(oct-ala)3·H2O, (c) H(oct-phe)·H2O, (d) Tb(oct-phe)3·H2O, (e) H(oct-ser), (f) Tb(oct-ser)3·3H2O.
The elemental analysis results of the three terbium complexes are shown in Table 1. The theoretical calculations of the three complexes are smaller than the experimental results. The structures of the three terbium complexes were determined using the elemental analysis results combined with the 1H NMR results. Note: Calc. stands for Calculation results; EA. represents the Elemental Analysis results.
Complexes
C (%)
H (%)
N (%)
Calc.
EA.
Calc.
EA.
Calc.
EA.
Tb(oct-ala)3·H2O
47.82
48.01
7.66
7.49
5.07
4.85
Tb(oct-phe)3·H2O
58.49
58.51
7.65
7.69
4.01
3.98
Tb(oct-ser)3·3H2O
44.60
44.58
7.77
7.80
4.73
4.75
3.2 FT-IR analysis
In order to obtain further information on the main functional group of the terbium complexes, IR spectroscopy analysis was performed. Fig. 2 shows the FT-IR spectra of the three terbium complexes. FT-IR is an effective method to identify the chemical information of the functional groups. The molecular structures of the terbium complexes were determined by combining the results of FT-IR, 1H NMR with elemental analysis. In Tb(oct-ala)3·H2O, Tb(oct-phe)3·H2O, and Tb(oct-ser)3·3H2O, the stretch vibration peaks of —CH3, —CH2, —CH are in the range of 2800–3000 cm−1. IR spectrum of Tb(oct-ala)3·H2O showed a peak at 1379 cm−1, which is a characteristic peak of side-chain —CH3. For Tb(oct-phe)3·H2O, a characteristic peak of benzene ring at 696 cm−1 was observed. For Tb(oct-ser)3·3H2O, peaks at 3272 cm−1 and 1032 cm−1 are the —OH stretch vibration. There are two sharp peaks at 1548 cm−1 and 1426 cm−1 and a broad peak at 2500–3200 cm−1, indicating the formation of a carboxylic acid. The results indicate that Tb3+ is linked to octanoyl amino acid ligands and forms coordination bonds with rare-earth ions replacing H in —COOH (Zhang, 2009; Li et al., 2019; Ning, 2002). It is worth noting that a broad stretching of the vibration absorption of H2O appears in the range of 3500–3300 cm−1. The out-of-plane bending vibration of the crystalline water molecules and the in-plane swing vibration of coordinated water molecules were observed at 555 cm−1 and 920 cm−1, respectively; This confirms that there exist both coordinated water molecules and crystal water molecules in the complexes (Chen et al., 2016).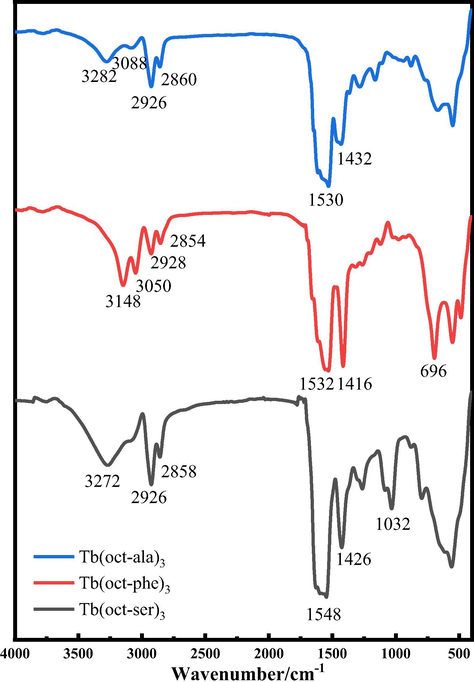
FT-IR spectra of the terbium complexes.
3.3 XRD analysis
In order to investigate the long-range/short-range structure of the rare-earth complexes, XRD measurements were carried out. The XRD results are shown in Fig. 3. Wide-angle XRD (WAXD) spectra of the three terbium complexes (Fig. 3 (1)) ranged from 6–80° show broad diffusion peaks between 15–25° (Jia et al., 2019). No sharp crystalline diffraction peaks was observed, which indicates that there exists long-range disorder and a rather disordered amorphous structure presents.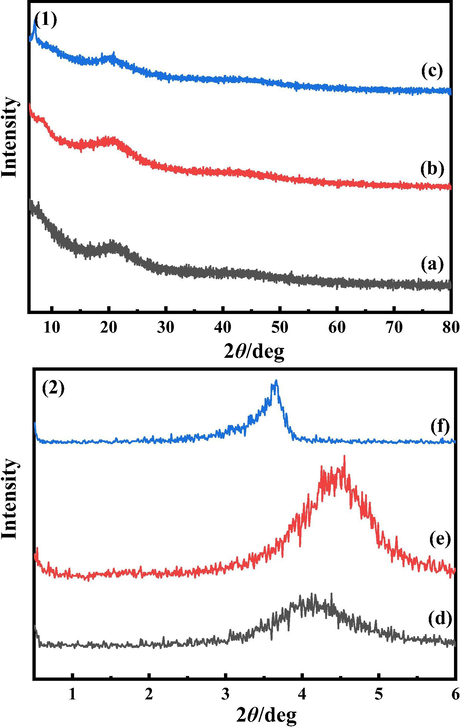
XRD spectra of terbium complexes. (1) WAXD (a) Tb(oct-ala)3·H2O (b) Tb(oct-phe)3·H2O (c) Tb(oct-ser)3·3H2O. (2) SAXD (d) Tb(oct-ala)3·H2O (e) Tb(oct-phe)3·H2O (f) Tb(oct-ser)3·3H2O.
The detecting range for small-angle XRD (SAXD) analysis is 0.5–6° (Fig. 3 (2)). The spectra show sharp peaks at small angles, which is characteristic of periodic short-range ordering (Fonollosa et al., 2004). The sharp peaks of Tb(oct-phe)3·H2O at 2θ = 4.5° and Tb(oct-ser)3·3H2O at 2θ = 3.5° indicate that these two complexes exhibit short-range ordering in the small angle range (0.5–6°). However, Tb(oct-ala)3·H2O shows a wide peak in the small angle range (0.5–6°), which indicates a tendency of a transition from short-range order to disorder and is more inclined to the formation of a glass state.
The average distance of adjacent atoms in the rare-earth complexes is calculated using the Bragg equation:
. The calculation results are shown in Table 2. The average distance between adjacent atoms of Tb(oct-phe)3·H2O in three rare-earth complexes is the smallest.
Sample
2θ/°
d/nm
Tb(oct-ala)3·H2O
4.09
2.1578
Tb(oct-phe)3·H2O
4.41
2.0019
Tb(oct-ser)3·3H2O
3.64
2.4252
3.4 Surface topography analysis
XRD results showed that Tb(oct-phe)3·H2O and Tb(oct-ser)3·3H2O have the characteristics of the long-range disorder and short-range order, while Tb(oct-ala)3·H2O has the tendency of long-range disorder and short-range disorder. To characterize the morphology of Tb(oct-ala)3·H2O, Tb(oct-phe)3·H2O, and Tb(oct-ser)3·3H2O, SEM experiments were carried out. The SEM images are shown in Fig. 4. The SEM results illustrated that all the complexes examined have irregular shapes (Ehab and Abdelrahman, 2019). Furthermore, the three ligands were not observed to have liquid crystal properties and showed specific rod-like and needle-like structures (Zhang et al., 2019). During the scanning process, the sample melted and deformed due to the temperature increase caused by the electron beam focusing, so the microstructure could only be observed roughly.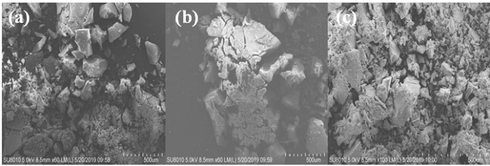
SEM images of (a) Tb(oct-ala)3·H2O, (b) Tb(oct-phe)3·H2O, (c) Tb(oct-ser)3·3H2O.
To further examine the optical properties of the three states, such as amorphous, crystalline, and liquid crystal state, the microscopic surface morphology of the three complexes were observed using polarized light microscopy below, at, and above the room temperature.
The Polarized Light Microscopy images of the Tb(oct-ala)3·H2O powder sample are shown in Fig. 5. The results show that Tb(oct-ala)3·H2O (Fig. 5) is a compound that can easily form transparent and uniform glassy compounds. The Tb(oct-phe)3·H2O sample show characteristics of optical anisotropy. As the temperature increased to 160 °C, the sample began to flow and presented optical homogeneity. As temperature decreased to 25 °C, little optical anisotropy appeared. In summary, Tb(oct-phe)3·H2O has liquid crystal properties. The Tb(oct-ser)3·3H2O (Fig. 5) exhibits optical anisotropy at 25 °C, but gradually exhibits optical homogeneity as the temperature increases and showed optical anisotropy under gradual cooling. In conclusion, Tb(oct-ser)3·3H2O has better liquid crystal properties than Tb(oct-phe)3·H2O.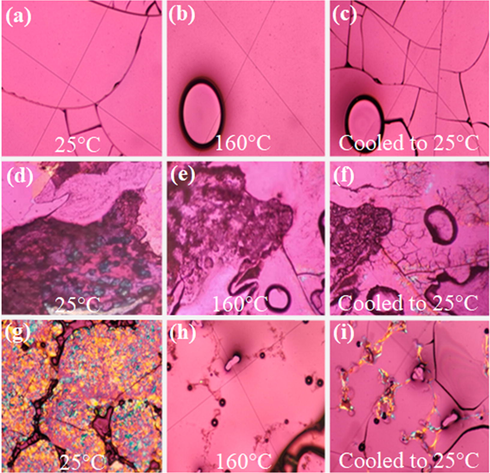
Polarized microscope images of three complexes at different temperatures. (a) (b) (c) Tb(oct-ala)3, (d) (e) (f) Tb(oct-phe)3, (g) (h) (i) Tb(oct-ser)3.
3.5 UV–Vis analysis
The UV–Vis absorption spectra of three rare-earth complexes, Tb(oct-ala)3·H2O, Tb(oct-phe)3·H2O and Tb(oct-ser)3·3H2O, with different concentrations were measured in the range of 200–400 nm in both ethanol solution. It is well known that the absorbance of rare-earth complexes is very small and the absorption of organic ligands is larger in the ultraviolet, visible region. As shown in Fig. 6(a-c), the absorption intensity of the complexes increased as the concentration increased. An absorption peak appeared at about 210 nm, which is due to the presence of —COOR group in the sample. The —COOR group directly connects with a heteroatom, which has an unpaired electron pair, producing n → π* transition. In Fig. 6 (b), in addition to the absorption peak at about 210 nm, there is another absorption peak at 258 nm, and the intensity of these two peaks is larger than that observed in Fig. 6 (a) and (c). This is due to the presence of benzene ring chromophore group, which causes a π–π* transition by conjugated effect, resulting in increased absorption. With the increase of concentration, the absorption intensity of the peak at 258 nm increased gradually (Yang, 2006). This deviates significantly from the Beer-Lambert law. For the reason that the concentration of the terbium complex is above 0.01 mol/L. When the concentration is high, the average distance between the absorbing particles decreases and their molar absorption coefficients change due to the interaction of the charge distribution between the particles, resulting in a deviation from Beer's law.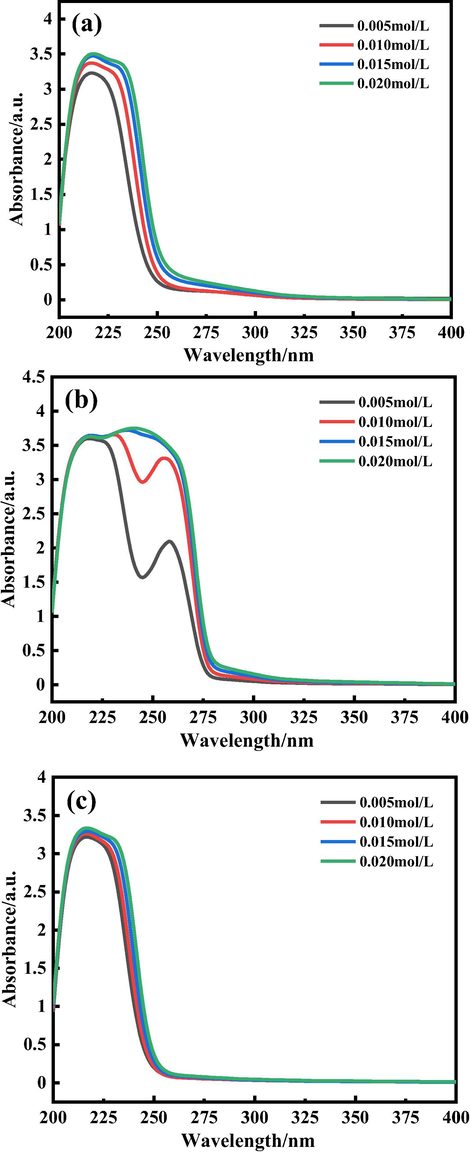
UV–vis spectra of the rare-earth complexes at varied concentrations. (a) Tb(oct-ala)3·H2O, (b) Tb(oct-phe)3·H2O, (c) Tb(oct-ser)3·3H2O.
From the diffuse reflectance of the thick sample, we can deduce the absorption spectrum of the complex samples. Then, whether the absorption of the compound is strong or weak, and whether it has a blue or redshift could be determined. Ultra Violet-Visible-Near Infrared (UV–vis–NIR) diffuse reflectance spectroscopy provides information on molecular vibrations, which has advantages for the simple test method, fast speed measurement, and loss of compound samples.
The ultraviolet–visible diffuse scattering of solid powders of three ligands and rare-earth complexes were measured in the range of 220–400 nm. The results are shown in Fig. 7. The shape and position of the peaks of the ligands and complexes were the same, except that the range of absorption peaks of rare-earth complexes increased more apparently than the ligands did, and the intensity of absorption of the complexes were slightly larger than the ligands. This could be attributed to the f-f transition of energy transfer to terbium after the ligands absorb light and rare earth ions also have some absorption, resulting in the increase in the range of the absorption peak (Bünzli and Piguet, 2006; Werts, 2005).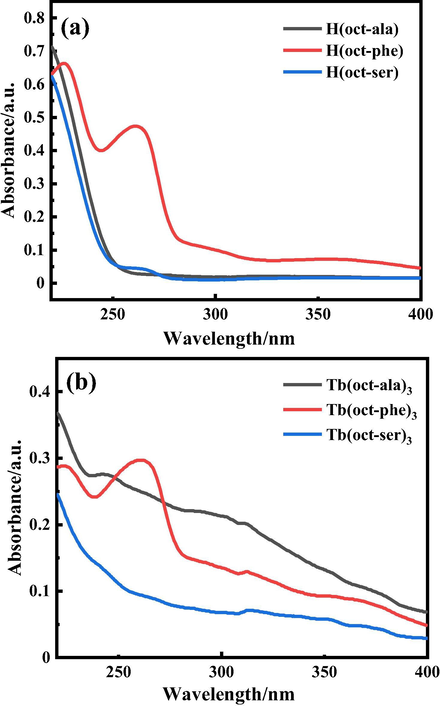
UV–Vis diffuse scattering spectra of powder samples of (a) H(oct-ala), H(oct-phe), and H(oct-ser) ligands and (b) Tb(oct-ala)3·H2O, Tb(oct-phe)3·H2O, and Tb(oct-ser)3·3H2O complexes.
3.6 Luminescence analysis
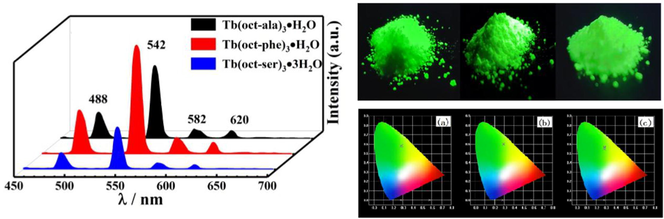
Fig. 8 (a), (b), and (c) show the emission spectra of the Tb(oct-ala)3·H2O, Tb(oct-phe)3·H2O, and Tb(oct-ser)3·3H2O complexes, respectively, at various concentrations in ethanol solution and powder form. The emission intensity of the three complexes in ethanol solution increased as the solute concentration increased. The luminescence spectra of the three powder complexes are shown in Fig. 8 (d). Tb(oct-phe)3·H2O has better luminescence intensity than the other two complexes. The emission spectra bands of these three complexes are sharp, and the half-peak width is narrow (less than10 nm). In Fig. 8, the four peaks at 488, 542, 582, and 620 nm correspond to the characteristic fluorescence peaks of Tb3+ (5D4 → 7F6), (5D4 → 7F5), (5D4 → 7F4), and (5D4 → 7F3), respectively (Li et al., 2018; Yang et al., 2018; Li et al., 2013). It is apparent that the strong, sharp emission line of terbium complexes occurs near 542 nm. The enhancement of Tb3+ emission is due to the octanoyl amino acid ligands. The polarity of Tb3+ is increased under the influence of the ligands, so that the electric dipole transition of 5D4 → 7F4 increased (Li et al., 2013). The emission spectra and chromaticity diagrams showed the characteristic fluorescence emission of terbium ion. The ligand has strong absorption in the ultraviolet region. It can effectively transfer excited state energy to the central ion through a non-radiative transition, thereby sensitizing the rare-earth ion to emit light and improving the luminous intensity of the rare-earth ion. Fig. 9 shows the pictures of the solid complex powders and ethanol solutions of the three terbium complexes irradiated by an ultraviolet lamp at 254 nm. The three complexes show bright green after an ultraviolet lamp at 254 nm. The powdered complex has a much brighter brightness than the complex in ethanol solution. When considering practical applications, the application of solid powder can maximize its optical performance.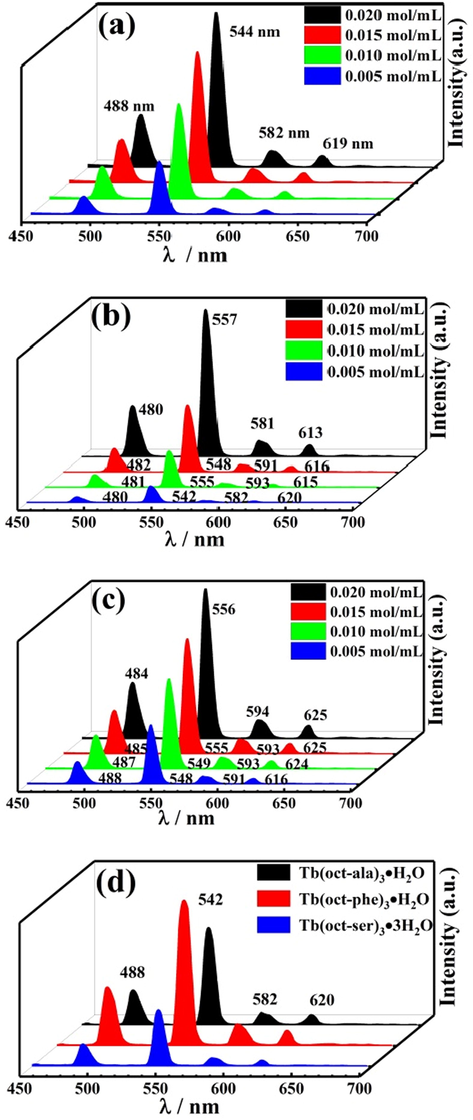
Emission spectra of different concentrations in rare-earth complex ethanol solution (a) Tb(oct-ala)3·H2O, (b) Tb(oct-phe)3·H2O, (c) Tb(oct-ser)3·3H2O, and (d) three complexes powders.
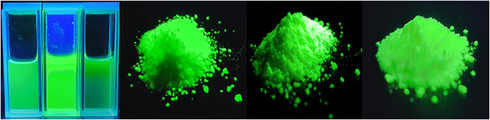
Pictures of the solid powder samples of three complexes, Tb(oct-ala)3·H2O, Tb(oct-phe)3·H2O, and Tb(oct-ser)3·3H2O, and the complex solutions in ethanol irradiated with an ultraviolet lamp at 254 nm.
Through the emission spectra of terbium complexes at different concentrations in an ethanol solution, the corresponding International Commission on Illumination (CIE) chromaticity diagrams are as shown in Fig. 10. In Fig. 10 (a-c), the locations of visible light are in the green area however, slightly different. A small peak appeared at 619 nm in the emission spectrum. This peak was in the range of red light. Fig. 10 shows that the different concentration of terbium complexes in ethanol solutions has a slight effect on the color location, but for Tb(oct-phe)3·H2O (Fig. 10 (b)), the color location did not change as the concentration of the complex changed, due to ethanol being a strong polar solvent. The polarity of the solvent has a larger transition of n → π* than π–π*. There is an n → π* transitions in the ethanol solution of terbium complexes. However, in Tb(oct-phe)3·H2O (Fig. 10 (b)), there is a transition from π–π*, which makes the color shift of Tb(oct-phe)3·H2O (Fig. 10 (b)) least affected by the transition (Liu, 2007). It is concluded that Tb(oct-phe)3·H2O has stable chroma display at different concentrations of ethanol solutions.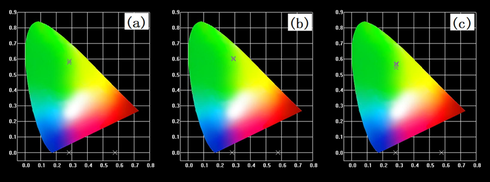
The CIE chromaticity diagrams of the rare-earth complex ethanol solutions (a) Tb(oct-ala)3·H2O, (b) Tb(oct-phe)3·H2O, (c) Tb(oct-ser)3·3H2O, and (d) powder samples of the three complexes.
The luminescence lifetime was determined by the excitation wavelength of 268 nm and the emission wavelength of 544 nm. The fluorescence lifetime diagram is shown in Fig. S1.
After fitting the curves exponentially, the equation (Ma et al., 2019) with a double-exponential peak shape was obtained. where y(t) shows the relationship between fluorescence intensity and time; y0 is the lifetime of Poisson noise; τ1 and τ2 are the lifetimes of each component; A1 and A2 are the intensity amplitudes at t = 0. The average lifetime of τ is as follows.
The calculated fluorescence lifetime of three complexes are shown in Table 3.
Powder
0.005 mol/mL
0.010 mol/mL
0.015 mol/mL
QY
Tb(oct-ala)3·H2O
0.524
1.618
1.706
1.735
13.34%
Tb(oct-phe)3·H2O
1.213
1.510
1.635
1.693
16.58%
Tb(oct-ser)3·3H2O
0.464
1.299
1.533
1.542
11.93%
The fluorescence lifetime is the time required to reduce the fluorescence intensity of the molecule to 1/e of the maximum fluorescence intensity after the excitation of the light pulse (Jin, 2018). The fluorescence lifetime of the powder sample of Tb(oct-phe)3·H2O is the largest which is consistent with the previously reported results (Ma et al., 2019). The fluorescence lifetime of three terbium complexes in ethanol solution is longer than that of the powder samples, and the values of fluorescence lifetime tend to be stable with the increase in concentration. When terbium complexes are dissolved in ethanol, due to the solvation kinetics, after light absorption, the solute is excited. The dipole moment of the solute changes, disturbing the solvent molecules around the solute and surrounding the solvent molecules (Li et al., 2018). The process of reorientation of the excited state solute increases the time a rare-earth complex is in the excited state and prolongs the fluorescence lifetime. The quantum yields of terbium complexes powder are also presented in Table 3. It can be seen overall that the changing rule of the QY is the same as the fluorescence lifetime and the value are less than 20%, this is consistent with other Tb (III) complexes (Harris et al., 2015; Laurent et al., 2014; Murase et al., 2013). Since the H(oct-phe) ligand has the benzene ring functional group, has the large conjugate structure, can transfer the energy more efficiently (Jiang, 2006). Furthermore, benzene ring chromophore group can absorb more energy in the ultraviolet range, the Tb(oct-phe)3·H2O has the highest QY (16.58%) and fluorescence lifetime (1.213) of three terbium complexes.
3.7 Theoretical calculations
To further examine the experimental results, we used density functional theory (DFT) (Parr and Weitao, 1989) to optimize the structure of the terbium complexes, analyze the molecular electrostatic potential, and calculated the infrared and 1H NMR spectra of the terbium complexes. The DFT calculations were performed using Gaussian 09 (Frisch et al., 2013).
First, the structure optimization of the terbium complex and the calculation of the molecular vibrational frequency were performed to obtain a stable configuration. Then, the molecular electrostatic potential surface diagram (Fig. 11) and FT-IR spectrum (Fig.S2) were plotted using the results of the calculations. The molecular electrostatic potential surface diagram (Fekry et al., 2020) revealed that there is a positive electrostatic potential around the central atom terbium. The larger the electrostatic potential, the darker the color in the corresponding picture is. Comparing the calculated infrared spectrum with the experimental IR spectrum, we observed that the positions and shape of the main characteristic peaks were consistent. Finally, the 1H NMR chemical shifts of the complex were calculated using the B792/gen method in DFT. The results are shown in Fig. S3. The peaks from the solvent were not included in the calculated 1H NMR spectrum. In the spectrum, the displacement of H in the complex appeared mainly in the low field, which is consistent with the experimental results. The calculated FT-IR and 1H NMR spectra of the complexes revealed that the structure of the complex we synthesized was the structure of the product we expected.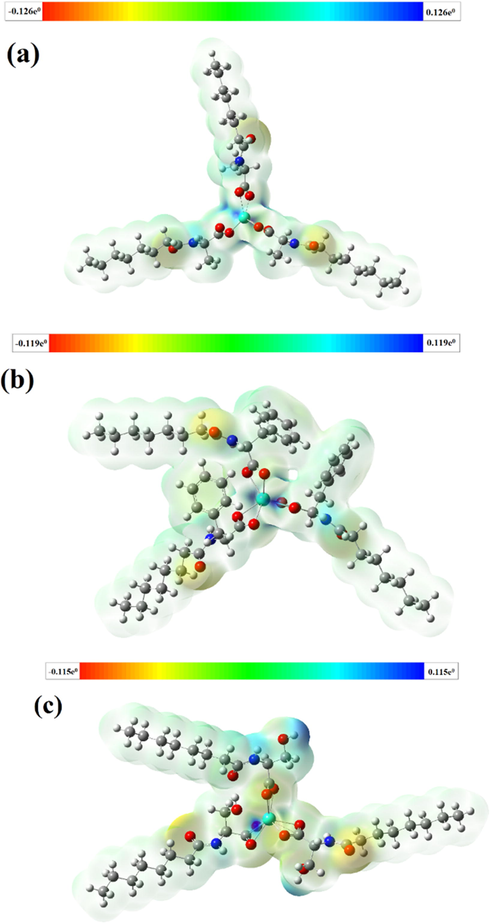
Molecular electrostatic potential surface maps of the terbium complexes. (a) Tb(oct-ala)3·H2O, (b) Tb(oct-phe)3·H2O, and (c) Tb(oct-ser)3·3H2O.
3.8 LED devices
The green LED device (Fig. 12) is made of ultraviolet chip (λem = 365 nm) combined with green-emitting phosphor (terbium complexes). It can be seen from the Fig. 12 that the LED device at 3.5 V voltage is significantly brighter than 3 V. Green light is one of the three primary colors, and the fact that terbium complex can be made into a green LED device proves that it can be used in white LEDS. The terbium complex synthesized in this paper has the advantages of simple synthesis method, clean environmental protection, low toxicity and so on, and applying in LED devices has a broad market prospect.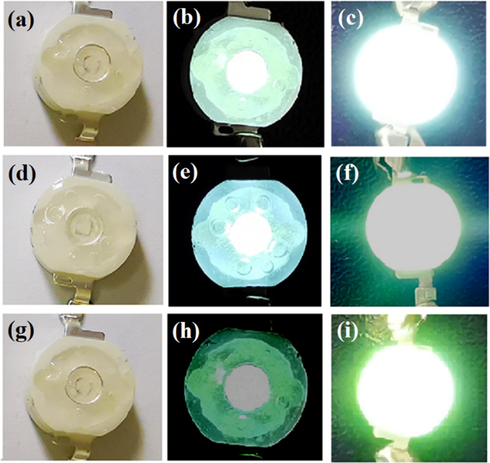
LED luminescent device of the terbium complexes. (a-c) Tb(oct-ala)3; (a) device (b) 3 V voltage (b) 3.5 V voltage. (d-f) Tb(oct-phe)3; (a) device (b) 3 V voltage (b) 3.5 V voltage. (g-i) Tb(oct-ser)3; (a) device (b) 3 V voltage (b) 3.5 V voltage.
4 Conclusions
Three terbium complexes of octanoyl amino acids, Tb(oct-ala)3·H2O, Tb(oct-phe)3·H2O, and Tb(oct-ser)3·3H2O, were synthesized using chemical reactions in solution. The results of 1H NMR, FT-IR, and elemental analysis confirmed the molecular structure of the complex products. DFT optimized the structure of the complex and provided the molecular electrostatic potential map, which shows the binding state of the chemical bond in the molecule. XRD results show that Tb(oct-phe)3·H2O and Tb(oct-ser)3·3H2O have characteristics of the long-range disorder and short-range order, while Tb(oct-ala)3·H2O tends to have both long-range and short-range disorder. SEM images of the complexes revealed that all the synthesized products had irregular shapes. Polarized light microscopy showed that Tb(oct-phe)3·H2O and Tb(oct-ser)3·3H2O might have liquid crystal properties, in particular for Tb(oct-ser)3·3H2O. The UV–Vis spectra showed that the ligands and rare-earth complexes had good absorption in the UV region (200–300 nm). The results of the emission spectroscopy revealed that the luminescent intensity of the three complexes increased with increasing concentration. Comparing the fluorescence spectra of the three powder complex samples, we observed that Tb(oct-phe)3·H2O had stronger luminescent intensity and larger quantum yield than the other two complexes. The fitting results of the fluorescence lifetime curve showed that the curve fit with the function of the double exponential type. The fluorescence lifetime of the powder Tb(oct-phe)3·H2O was calculated to be larger than the other two complexes.
To sum up, Tb(oct-ala)3·H2O tends to be in a glass state, which can be used in solar cells to absorb ultraviolet light. Tb(oct-phe)3·H2O has excellent UV absorption and luminescence performance. Therefore, it is good for banknote anti-counterfeiting; could be used as a polishing powder, and for organic light-emitting diode, etc. The optical properties of Tb(oct-ser)3·3H2O are excellent, which allows the potential liquid crystal applications. The green LED device is made of terbium complex, which proves that the synthesized terbium complexes can be used as phosphor in LED.
Acknowledgements
This work is supported by the National Natural Science Foundation (21663018), the National Natural Science Foundation (21762033), and the Natural Science Foundation of Inner Mongolia (2018MS02011).
Declaration of Competing Interest
The authors declare that there are no conflicts of interest.
References
- Comparative Study of the Luminescence Properties of the Europium(III) Complexes of the Squarate, Phenylsquarate, and (Diphenylamino) squarate Ligands. Inorg. Chem.. 1999;38(26):6278.
- [Google Scholar]
- Rising stars in science and technology: luminescent lanthanide materials. Eur. J. Inorg. Chem.. 2017;44(S1):5058.
- [Google Scholar]
- Taking advantage of luminescent lanthanide ions. Chem. Soc. Rev.. 2006;34(12):1048.
- [Google Scholar]
- Tunable white-light emission PMMA-supported film materials containing lanthanide coordination polymers: preparation, characterization, and properties. Dalton Trans.. 2017;46(13):4265.
- [Google Scholar]
- Synthesis and luminescent properties of terbium complex with 2-amino-4-chlorobenzoic acid. J. Rare-earths. 2016;34(3):240.
- [Google Scholar]
- Ehab, A., Abdelrahman, Hegazey, R.M., Ragaa, E.A.E., 2019. Efficient removal of methylene blue dye from aqueous media using Fe/Si, Cr/Si, Ni/Si, and Zn/Si amorphous novel adsorbents. J. Mater. Res. Technol. 8(6), 5301.
- Fekry, A.M., Shehata, M., Azab, S.M., Walcarius, A., 2020. Voltammetric detection of caffeine in pharmacological and beverages samples based on simple nano- Co (II, III) oxide modified carbon paste electrode in aqueous and micellar media. Sens. Actuat. B: Chem. 302.
- Fonollosa, J., Campos, L., Martı́, M., Coderch, L., 2004. X-ray diffraction analysis of internal wool lipids. Chem. Phys. Lipids 130(2), 159.
- Frisch, M.J., Trucks, G.W., Schlegel, H.B., Scuseria, G.E., Robb, M.A., Cheeseman, J.R., et al, 2013. Gaussian, Inc.
- Luminescence and white light emitting luminescent sensor of tetrafluoroterephthalate-lanthanide metal-organic frameworks. Dalton Trans.. 2017;46(14):4642.
- [Google Scholar]
- Magnetofluorescent micellar complexes of terbium (III) as potential bimodal contrast agents for magnetic resonance and optical imaging. Chem. Commun.. 2015;51(14):2984.
- [Google Scholar]
- In vitro expression of genetically encoded non-standard peptides consisting of exotic amino acid building blocks. Curr. Opin. Biotechnol.. 2019;58:28.
- [Google Scholar]
- Efficient two-photon-sensitized luminescence of a novel europium (III) β-diketonate complex and application in biological imaging. Chem. Commun.. 2011;47(46):12467.
- [Google Scholar]
- Progress of Study on Red Fluorescence Europium Complexes. Chemistry (Huaxue Tongbao). 2008;10:746.
- [Google Scholar]
- Structural characteristics and functional properties of soluble dietary fiber from defatted rice bran obtained through Trichoderma viride fermentation. Food Hydrocolloids. 2019;94:468.
- [Google Scholar]
- Synthesis and Luminescence of Rare Earth (Eu(III), Tb(III)) complexes. Harbin Engineering University; 2006.
- Molecular Emission Spectroscopy. Chemical Industry Press; 2018.
- Bifunctional Gd(III) and Tb(III) chelates based on a pyridine-bis(iminodiacetate) platform, suitable optical probes and contrast agents for magnetic resonance imaging. Contrast Media Mol. Imaging. 2014;9(4):300.
- [Google Scholar]
- Reversible phase transition of robust luminescent hybrid hydrogels. Angew. Chem. Int. Ed.. 2018;57(8):2194.
- [Google Scholar]
- Grafting of derivatives of naphthalic anhydride onto amine-modifed surfaces of dense nanosilica and their fractal features for luminescent performance. J. Lumin.. 2019;206:547.
- [Google Scholar]
- Efficient red emission from PMMA films doped with 5, 6-DTFI europium (III) complexes: synthesis, structure and photophysical properties. Dalton Trans.. 2013;42(32):11537.
- [Google Scholar]
- Rare Earth Materials. Chemical Industry Press; 2007.
- Metal-organic frameworks: functional luminescent and photonic materials for sensing applications. Chem. Soc. Rev.. 2017;46(11):3242.
- [Google Scholar]
- Luminescent materials of covalent grafting lanthanide complexes to the synthetic clays. J. Luminescenc.. 2019;212:126.
- [Google Scholar]
- Enantioselective aggregation and luminescence properties of europium (III) and terbium (III) complexes of an acetate and a tripodal ligand containing three imidazole groups. Polyhedron. 2013;59:76.
- [Google Scholar]
- Ning, Y.C., 2002. Structural Identification of Organic Compounds and Organic Popper Science, 2nd ed., 485.
- Formation of molecular glasses and the aggregation in solutions for lanthanum(III), calcium(II) and yttrium(III) complexes of octanoyl-DL-alaninate. 2008;13:1698-1709.
- Density-Functional Theory of Atoms and Molecules. Oxford: Oxford Science; 1989.
- Production of sheep milk cheese with high γ-aminobutyric acid and ornithine concentration and with reduced biogenic amines level using autochthonous lactic acid bacteria strains. Food Microbiol.. 2019;78:1.
- [Google Scholar]
- Synthesis and infrared and fluorescence spectra of rare-earth complexes with a novel amide-based ligand. Spectrochim. Acta Part A Mol. Biomol. Spectrosc.. 2007;66(4–5):1058.
- [Google Scholar]
- Dynamic coordination of Eu–iminodiacetate to control fluorochromic response of polymer hydrogels to multistimuli. Adv. Mater.. 2018;30(11)
- [Google Scholar]
- Printable fluorescent hydrogels based on self-assembling peptides. Scientific Report. 2017;7(1):1.
- [Google Scholar]
- Flexible and transparent films consisting of lanthanide complexes for ratiometric luminescence thermometry. J. Colloid Interface Sci.. 2018;519:11.
- [Google Scholar]
- Thermochemical properties of rare-earth complexes with salicylic acid. Thermochim. Acta. 2007;463(1–2):60.
- [Google Scholar]
- Yang, C., 2006. Photoluminescence Properties of Rare-earth Organic Complexes and Their Composites. Beijing University of Chemical Technology.
- Organic Spectrum Analysis. People's Health Publishing House; 2009.
- Research progress on rare-earth amino acid complexes. Chinese Rare-earths. 2019;40(3):127.
- [Google Scholar]
- Synthesis and performance analysis of octanoyl amino acid compounds. J. Inner Mongolia Normal Univ. (Natural Sciences Edition). 2019;48(5):1.
- [Google Scholar]
Appendix A
Supplementary material
Supplementary data to this article can be found online at https://doi.org/10.1016/j.arabjc.2021.103033.
Appendix A
Supplementary material
The following are the Supplementary data to this article:


