

Translate this page into:
Synthesis, characterization and biological evaluation of N-Mannich base derivatives of 2-phenyl-2-imidazoline as potential antioxidants, enzyme inhibitors, antimicrobials, cytotoxic and anti-inflammatory agents
⁎Corresponding author. nullah@qau.edu.pk (Naseem Ullah)
-
Received: ,
Accepted: ,
This article was originally published by Elsevier and was migrated to Scientific Scholar after the change of Publisher.
Abstract
Imidazoline is a promising bioactive compound in medicinal chemistry. A series of novel derivatives of 2-phenyl-2-imidazoline (SP1-SP13) were synthesized and their structural characterization was done by spectroanalytical techniques. A diverse spectrum of biological activities has been presented and synthesized molecules are evaluated for their antioxidant, α-amylase inhibitory, antimicrobial, cytotoxic, in vitro and in vivo anti-inflammatory activities. SwissADME software and the BOILED-Egg method was used to evaluate the compound's pharmacokinetic parameters.
Abstract
A series of N-Mannich base derivatives of 2-phenyl-2-imidazoline with substituted amines (1–13) were designed, synthesized, and characterized by spectroanalytical techniques. The newly synthesized compounds (SP1-SP13) were evaluated biologically for their antioxidant, α-amylase enzyme inhibition, antimicrobial, cytotoxic, and anti-inflammatory activities. Compounds were analyzed to predict their drug-likeliness behavior SP11 showed good activity in % FRSA against DPPH free radical at IC50 of 148.16 ± 2.81 µg/mL. SP11 and SP13 exhibited good antioxidant responses in TAC and TRP assays, respectively. SP2 has shown maximum % inhibition against α-amylase enzyme to 94.02 ± 0.2% at 200 µg/mL. SP2, SP8, and SP12 exhibited potent effect against α-amylase enzyme at IC50 value of 9.20 ± 0.48, 10.25 ± 0.43, and 13.81 ± 0.90 µg/mL, respectively. Compounds showed good to moderate activity against all bacterial and fungal strains. The compounds were selected for further analysis against hepatocellular carcinoma cell line (HepG2) based on LD50 and IC50 values obtained in brine shrimp cytotoxicity and biocompatibility assay, respectively. SP3, SP12, and SP13 were evaluated at 24, 48, and 72 h against HepG2 cells. Maximum response was observed at 72 h. A dose-optimization study was conducted and in vivo anti-inflammatory activity was performed on SP3, SP12, and SP13 based on results obtained from in vitro NO assay. The results are compared to that of standard (acetylsalicylic acid).
Keywords
N-Mannich base derivatives
Antioxidants
Enzyme inhibition
Antimicrobial
MTT assay
Anti-inflammatory assay

- 2-P1
-
2-Phenyl-2-imidazoline
- BBB
-
Blood-brain barrier
- GIT
-
Gastrointestinal tract
- FRSA
-
Free radical scavenging activity
- TAC
-
Total antioxidant capacity
- TRP
-
Total reducing power
- ASA
-
Acetylsalicylic acid
- DPPH
-
Diphenyl-1-picrylhydrazyl
- NO
-
Nitric oxide
- P-gb
-
P-Glycoprotein
- SEM
-
Standard error of the mean
- SD
-
Standard deviation
- DMSO
-
Dimethylsulfoxide
- COX
-
Cyclooxygenase
- ADME
-
Absorption, distribution, metabolism, excretion
- PK
-
pharmacokinetic
- AAE
-
Ascorbic acid equivalent
- LD
-
Lethal dose
- IC50
-
half-maximal inhibitory concentration
- TLC
-
Thin layer chromatography
- RO5
-
Rule of five
- MIC
-
Minimum inhibitory concentration
Abbreviations
1 Introduction
With the development of technologies and discoveries, organic synthesis has benefited science and society both directly and indirectly. Organic chemistry, together with other sciences has helped to address global problems like nutrition and public health, making it possible to have a workable and friendly environment for life and mankind on our globe (Nicolaou, 2018). Organic chemistry provided the path leading to a number of scientific discoveries not only in the field of chemistry but also in biology and medicine (Nicolaou et al., 2000).
During the 20th century with the advancement in organic chemistry, chemists started mixing synthetically useful reactions with the names of those who discovered them. Well known includes Sabatier reaction, Diels-Adler reaction, Grignard reaction, Witting reaction, Claisen Condensation reaction, Mannich reaction, Suzuki-Miyaura reaction, Negishi coupling reaction, etc. (Heravi et al., 2018).
Aldol (Palomo et al., 2002), nitro-Aldol (Palomo et al., 2007), and Mannich reactions (Kobayashi et al., 2011) are considered basic carbon–carbon bond-forming reactions in organic chemistry because they involve the addition of C—H nucleophile to C⚌X bond and have been studied extensively (Noble and Anderson, 2013). The reaction between aldehydes, amines, or ammonia and heterocyclic acidic proton-containing pharmacophores is known as a Mannich reaction (Mannich and Krösche, 1912). The diverse and complex structural motifs as a result of a three-component reaction have attracted medicinal chemists (Morisaki et al., 2020). Mannich reactions have been employed in the synthesis of natural products as well as in medicinal chemistry (Iijima et al., 2020; Córdova, 2004). The reaction is mostly employed for the synthesis of nitrogenous molecules (Aza Mannich reaction) (List, 2000).
The diverse biological molecules are frequently accessed by the Mannich reaction and it has widespread applications in crop protection, macromolecular material industry and the polymer and paint industry (Tramontini and Angiolini, 1994; Tramontini et al., 1988). Mannich reactions have practical applications in the macromolecular material industry, such as manufacturing of leather paper, synthetic polymers, additives in the petroleum industry, analytical reagents, dyes, cosmetics, etc. It is also helpful in the manufacturing of chemicals used as plant growth regulators in the agricultural industry (Idhayadhulla et al., 2014). However, the major contribution was made in the field of medicine and pharmaceutical industry (Overmann and Ricca, 1991) where Mannich reaction offers a wide range of biological activities such as anticancer (Xu et al., 2020), antimicrobial (Prakash and Raja, 2013), anti-inflammatory (Sivakumar et al., 2014), anthelmintic (Bamnela and Shrivastava, 2012), analgesic (Köksal et al., 2007), anticonvulsant (Czopek et al., 2016) and so on. The biological potential of Mannich bases is far from being exhaustive. There exist many examples of clinically approved drugs that consist of aminoalkyl chains, such as ranitidine, cocaine, atropine, amodiaquine, ethacrynic acid, procyclidine, etc. (Racane et al., 2001; Kashiyama et al., 1999; Bhusare et al., 2001). Few of the clinically approved drugs having N—C—N and C—C—N entities are summarized in Fig. 1.1. There have been many Mannich bases reported in the literature derived from thiophene and kojic acid (Fig. 1.1.).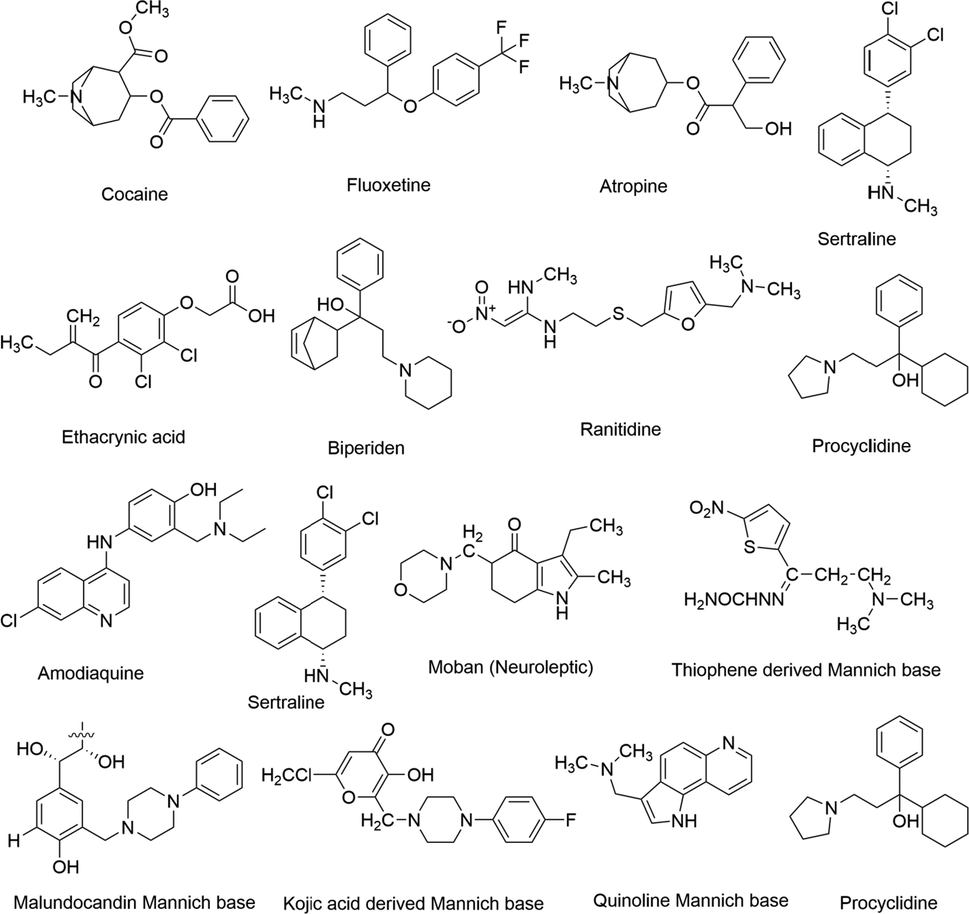
Examples of Mannich bases derived from heterocyclic rings having aminoalkyl chains.
Imidazole ring is an important nitrogen-containing heterocyclic scaffold in medicinal chemistry and is immensely distributed in natural and synthetic products (Zheng et al., 2020). It has amphoteric nature and an electron-rich structure. Due to its significant structural features, it can interact with biological receptors and targets, thereby exhibiting biological properties (Wright, 1951; Bhatnagar et al., 2011; Ingle and Magar, 2011). It was discovered in the early 1840s but first synthesized by Heinrich Debus in 1858 (Debus, 1858). Ever since its discovery, hundreds of its derivatives have been synthesized and this number is getting increased due to its wide applications as medicinal drugs, biomimetic catalysis, agrochemicals, supramolecular ligands, and so on (Hill, 2009; Forte et al., 2009; Jin, 2011; Gao et al., 2002). Imidazole-based derivatives have gained much attraction in medicinal chemistry because of their significant contribution to the clinical field to treat medical conditions (Mishra and Ganguly, 2012; Zhang et al., 2014) and there has been extensive literature on the medicinal value of these nitrogen-containing scaffolds.
There are many examples of FDA approved drugs that contain imidazole ring and are being used extensively as an antiviral (Sharma et al., 2009), antifungal (Feldman, 1986), antibacterial (Atia, 2009), anti-cancer (Krȩżel, 1998), anti-inflammatory (Rupčić et al., 2010), anti-tubercular (Bendagude and Kondawar, 2017), and antihypertensive agents (Anupam et al., 2018). Few examples of FDA-approved drugs having an imidazole ring system are summarized in Fig. 1.2.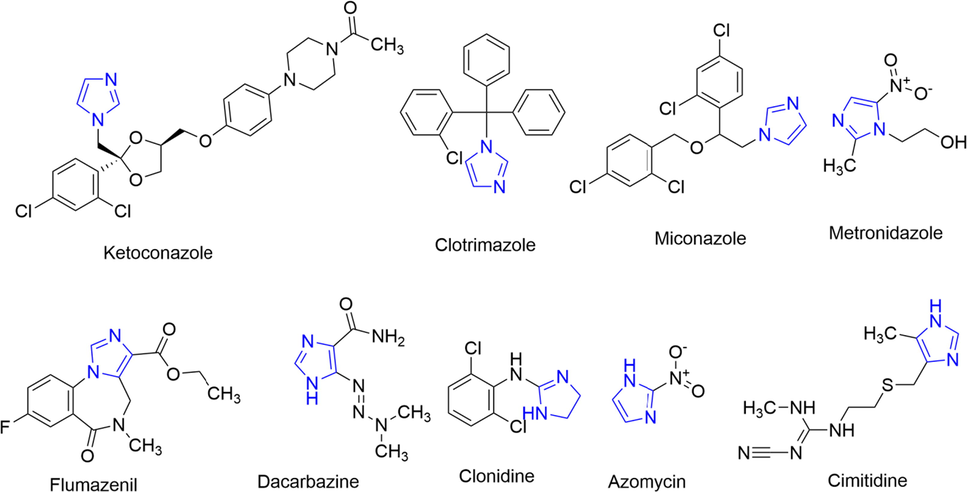
Selected examples of imidazole-containing FDA approved drugs.
Clonidine is an anti-hypertensive drug having a 2-imidazoline ring. Among the imidazoline derivatives, 2-imidazoline is most active and its derivatives have anti-inflammatory, anti-hypertensive, anti-diabetic, and anti-depressant properties (Liu and Du, 2009; Dardonville and Rozas, 2004).
During past decades, there has been done great work by medicinal chemists on synthesizing imidazole-based derivatives and evaluated their therapeutic properties (Fig. 1.3). Compound 1 (Sharma et al., 2009); 2 (Zampieri et al., 2007); and 3 (Shreenivas et al., 2011) have activities against bacterial and fungal strains. Compounds 4 and 5 exhibited analgesic and anti-inflammatory activities (Shalini et al., 2010; Achar et al., 2010). Compounds 6 and 7 showed anti-cancer activity (Refaat, 2010). Compound 8 exhibited good antiviral activity (Tonelli et al., 2010) and compound 9 exhibited significant activity against Leishmania donovani (Bhandari et al., 2010). Compound 10 exhibited antimicrobial and anticonvulsant properties (Shanmugasundaram et al., 2009).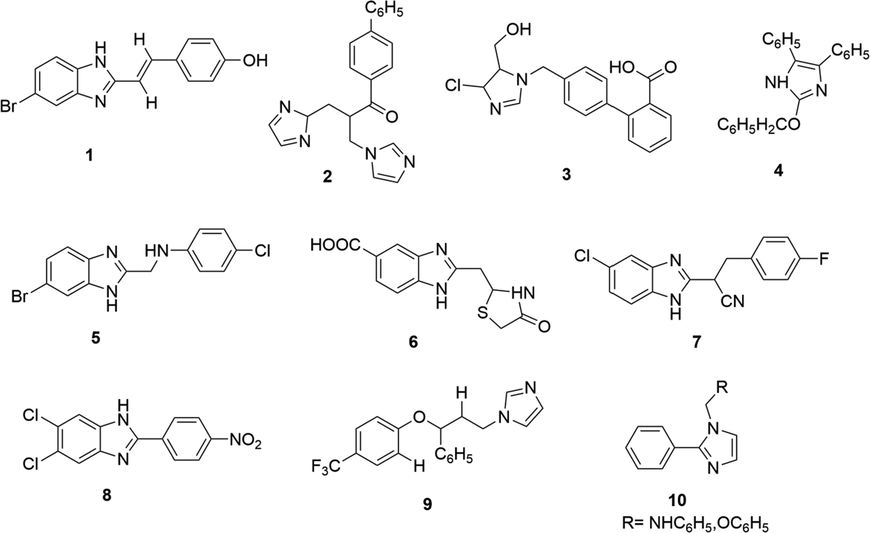
Imidazole-based derivatives having diverse biological activities.
Motivated by the structural features of the imidazoline nucleus and the enhanced biological spectrum of β-aminomethylated groups i.e. Mannich base, we aimed to design and synthesized new molecules having activities against free radical, infections caused by different fungal and bacterial strains, tumors and inflammation. To achieve such biomolecules, we hybridized 2-phenyl-2-imidazoline moiety into the series of amines via a linker group. The conjugation and incorporation of different functional moieties within the existing bioactive scaffold is an attractive and appealing approach to design, formulate, and synthesize new bioactive compounds that possess synergistic biological properties of all the reactants (Kumar et al., 2012). Keeping that approach in mind and the versatile biological profile of imidazoline heterocyclic ring, in the present study we have synthesized N-Mannich base derivatives of the 2-phenyl-2-imidazoline moiety. The entire synthetic library compounds were then evaluated biologically for their insilico, antioxidant, α-amylase enzyme inhibition, antibacterial, antifungal, cytotoxic, and anti-inflammatory potential. The N-Mannich bases synthesized in the present work and their comprehensive biological profile has not been reported in the literature to date.
2 Results and discussion
2.1 Chemistry
With the development in the Mannich reaction, it was concluded that the Mannich reaction is a nucleophilic addition reaction where an amine reacts with an aldehyde (formaldehyde) to form an iminium ion, followed by dehydration to form a Schiff base. The Schiff base acts as an electrophile and reacts with an iminium ion which results in the synthesis of the Mannich base, the end product of the Mannich reaction (Aljamali et al., 2015). The disconnection approach is used to determine the mechanism of action of all the products. In scheme 2.1, the Mannich base is disconnected from all of its known reactants. The disconnection occurs between a carbon and nitrogen bond. From the disconnection approach, it is clear that the product consists of an aldehyde, a secondary amine and an imidazoline nucleus. The general mechanism of the Mannich reaction involving iminium ions is described in Fig. 2.1.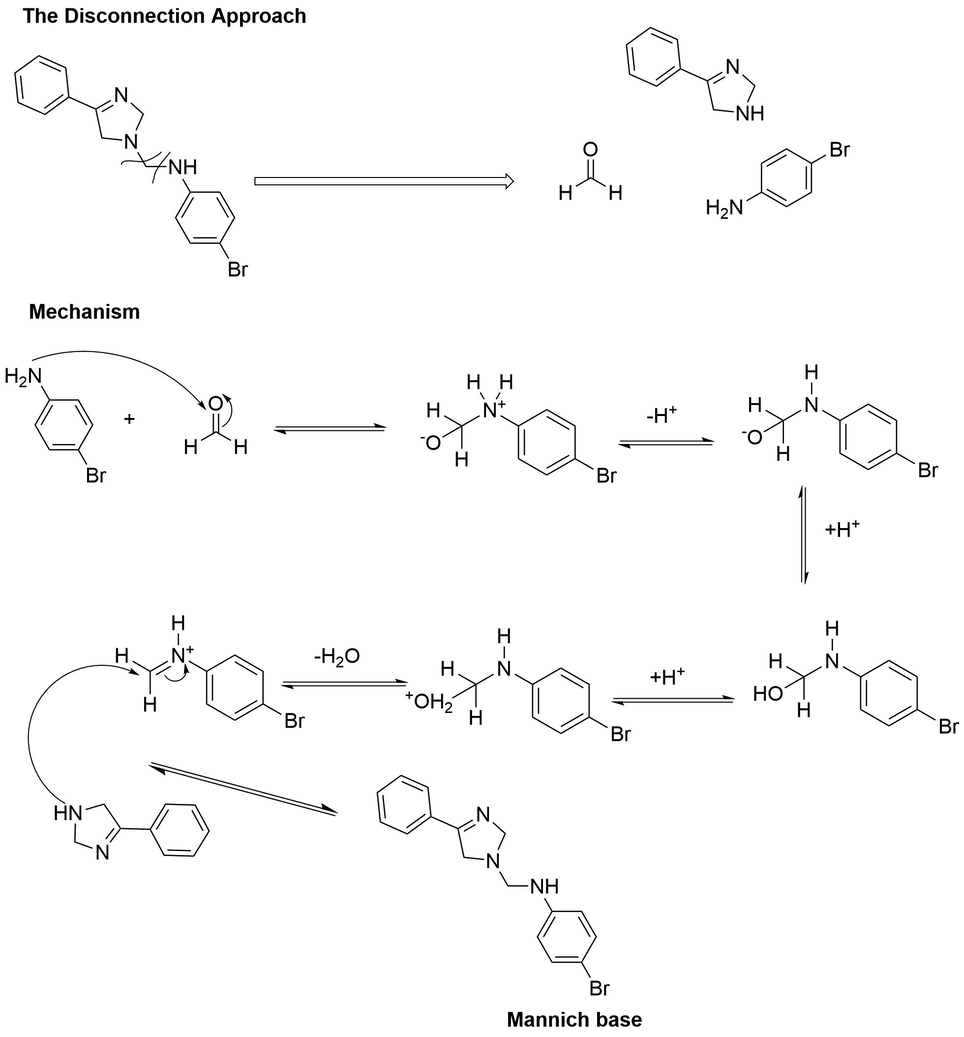
The postulated reaction mechanism of the Mannich reaction by the disconnection approach.
At first, formaldehyde attacks an amine (4-bromo aniline) to form the iminium ion. This reaction takes place in an acidic medium. Water is released as the only byproduct during this condensation reaction (Farooq et al., 2020). In the second step, the iminium ion starts attacking the acidic proton containing pharmacophore (2-phenyl-2-imidazoline), which results in the formation of the Mannich base.
Alexander and Underhill studied the kinetics of the Mannich reaction and concluded from their findings that the Mannich reaction is 3rd order reaction with no primary salt effect. This kinetic model was studied in acidic conditions, for this reason, there remained limitations for kinetic studies (Cummings and Shelton, 1960). This limitation was ruled out in a study conducted in 1949, where the reaction pathway showed involvement of iminium ion in both acidic as well as basic medium.
The substrate used in the Mannich reaction must have an acidic proton attached to a heteroatom (Farooq et al., 2020). In the synthetic library of compounds SP1-SP13, 2-phenyl-2-imidazoline acts as a substrate, having an acidic proton attached to a nitrogen heteroatom thus making it a nucleophilic site (Tramontini et al., 1988). Formaldehyde in the form of formalin solution (37%) acts as a linker group. All the newly synthesized compounds were thoroughly characterized by various spectroanalytical techniques. In the 1H NMR spectrum of the compounds, aromatic protons were mostly observed at downfield shift. The phenyl protons were observed deshielded at δ 7.00 to 8.11 ppm. The protons of the substituted amines were mostly observed at upfiled region of the 1H NMR spectra. The linker methylene bridge (—N—CH2—N—) was resonated around δ 3.73–3.77 and 4.43–4.61 ppm and gave a singlet (s) which attributes to 2 methylene protons. In SP2, the methylene bridge was observed at δ 3.91 ppm and gave a triplet (t). In SP8, SP11, and SP13, —N—CH2—N— the signal was observed as singlet (s) around δ 5.13 and 5.45 ppm, respectively. The most downfield chemical shifts observed in the spectrum of these compounds were due to the presence of an electronegative atom (-Br) in SP8 and acetyl group attached to a phenyl ring (acetaminophen substituted) in SP13. 13C NMR spectrum further assisted in the identification of the structure of synthetic compounds. Solvent peaks for CDCl3 and DMSO‑d6 were observed at δ 77.2 ppm and 39.5 ppm, respectively in 13C NMR spectra and for 1H NMR spectra, the peaks were observed at δ 7.26 ppm for CDCl3 and δ 2.50 ppm for DMSOd6. All other aromatic signals were observed in the expected regions. In the mass spectral analysis of synthetic compounds (SP1-SP13), the molecular ion peak for these compounds was observed as (M+) for all the compounds.
2.2 ADME predictions and pharmacokinetic profiling of synthetic compounds
Drug-likeliness prediction is important to optimize pharmaceutical, pharmacokinetic and pharmacological properties of the newly synthesized compounds. The drug-likeliness of the synthetic library was estimated using online tools. ADME properties of the synthetic compounds were predicted by SwissADME software. The data obtained from the online tool is presented in Table 2.1.
Comp. Name
MW 1 < 500
HBA 2 (<10)
HBD 3 (<5)
Log Po/w (iLOGP) 4 (<5)
Log Po/w (MLOGP) 5 (<5)
P-gb substrate 6
CYP Inhibition 7
Lipinski violation
SP1
245.35
2
0
2.70
2.65
Yes
2D6
No
SP2
245.32
3
0
2.41
1.54
Yes
–
No
SP3
229.32
2
0
2.61
2.80
Yes
2D6
No
SP4
259.39
2
0
3.38
3.30
No
2D6
No
SP5
258.36
3
0
2.82
2.20
Yes
2D6
No
SP6
244.34
3
1
2.62
1.54
Yes
–
No
SP7
327.42
1
0
2.97
4.74
No
1A2, 2C19, 2C9, 2D6, 3A4
1
SP8
330.22
1
1
3.04
3.95
No
1A2, 2C219, 2C9, 2D6
No
SP9
285.77
1
1
2.90
3.83
No
1A2, 2C19, 2D6
No
SP10
293.36
2
0
2.25
3.28
No
2C19
No
SP11
281.35
2
1
2.79
2.98
No
1A2, 2D6
No
SP12
231.34
2
0
2.98
2.80
No
2D6
No
SP13
309.36
3
1
2.13
2.72
No
–
No
All synthetic compounds were druglike according to Lipinski’s rule except SP7 that was partially following the Lipinski rule of five. To completely follow the Lipinski rule, test compounds should comply with all the below-mentioned conditions;
-
(1)
Molecular weight should be < 500 Dalton
-
(2)
Hydrogen bond acceptors must be < 10
-
(3)
Hydrogen bond donors should be < 5
-
(4)
iLOGP should be < 5
-
(5)
MLOGP should be < 5
As from Table 2.1, it is evident that SP7 is not following rule number 5 i.e. MLOGP = ∼5. This data represents the lipophilicity profile of SP7. There are many examples of marketed drugs that violate Lipinski RO5, but generally, it is acceptable that any drug that violates not more than one parameter can be a good active oral drug (Yehye et al., 2012). For example, sorafenib is out of range for molecular weight and AlogP values of the lead-like rule. Despite this fact, sorafenib has been approved by FDA for renal cell carcinoma (Wilhelm et al., 2006) and studies suggest its efficacy in prostate cancer as well (Oh et al., 2012).
These provided absorptions, distribution, and metabolism parameters of compounds that help in predicting whether the compound will be able to reach the bloodstream, distribute to the site of action, and will be metabolized to non-toxic water-soluble metabolites for elimination. The SwissADME software provides information regarding blood–brain barrier permeability, water-solubility, lipophilicity, human intestinal absorption, plasma protein binding and interaction with cytochrome P45 enzyme. These compounds were also substrates for p-gp that can manage the entry of synthetic compounds in the blood and the brain. It is also necessary for the compounds to be metabolized to ensure their elimination and prevent accumulation in the body. This helps in managing plasma concentration for a specific time and minimizes possible side effects (Waseem et al., 2017). Moreover, compounds were also predicted to inhibit CYP450 enzymes including 2C9, 2C19, 2D6, and 3A4. SP1, SP3, SP4, SP5, and SP12 only inhibited 2D6. SP10 inhibited 2C19. Others can inhibit more than one enzyme. This means that these compounds have the potential to interfere with the metabolism of other drugs or chemicals metabolized by the inhibited enzymes. SP2, SP6, and SP13 were not predicted to inhibit any CYP enzyme. Thus, these compounds can affect their metabolism beside other drugs and may lead to accumulation or reduced activity. Concisely, compounds have a sort of average in silico ADME profile that can be explored in vivo and such compounds can be considered for further evaluation (Waseem et al., 2017).
The BOILED-Egg method gives information about the GIT (gastro intestinal) absorption and blood–brain barrier (BBB) permeability of any compound. All of the compounds exhibited high GI absorption except for SP5 and SP6. The appearance of the blue dots represents that the drug can be actively effluxed with the help of P-gb substrate and the red dot represents as non-substrate of P-gb. The location of these dots provides information related to absorption or permeability. The BOILED-Egg representation of the synthetic library is described in Fig. 2.2.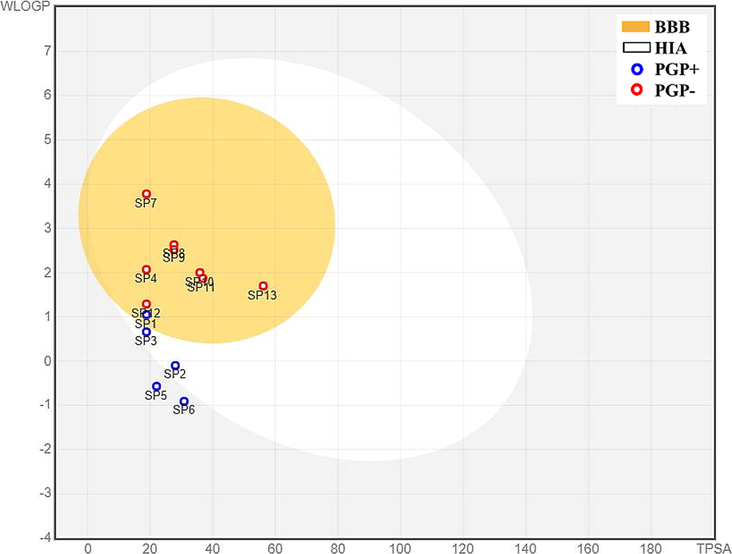
BOILED-Egg representations of absorption and distribution properties of SP1-SP13 compounds. Egg white represents human intestinal absorption (HIA), whereas egg yolk (yellow) shows blood-brain barrier permeability (BBB).
2.3 Biological evaluation of synthetic compounds
2.3.1 Antioxidant evaluation
2.3.1.1 % Free radical scavenging assay (DPPH Assay)
The antioxidant potential of the synthetic compounds was evaluated by the DPPH (Diphenyl-1-picrylhydrazyl) method. The potential of the synthetic compounds to scavenge the free radical (DPPH) is monitored by the discoloration of the DPPH reagent from purple to yellow color (Rahman et al., 2017). Quercetin and ascorbic acids were used as standards. The results of % FRSA (free radical scavenging assay) of the synthetic library are summarized in Fig. 2.3.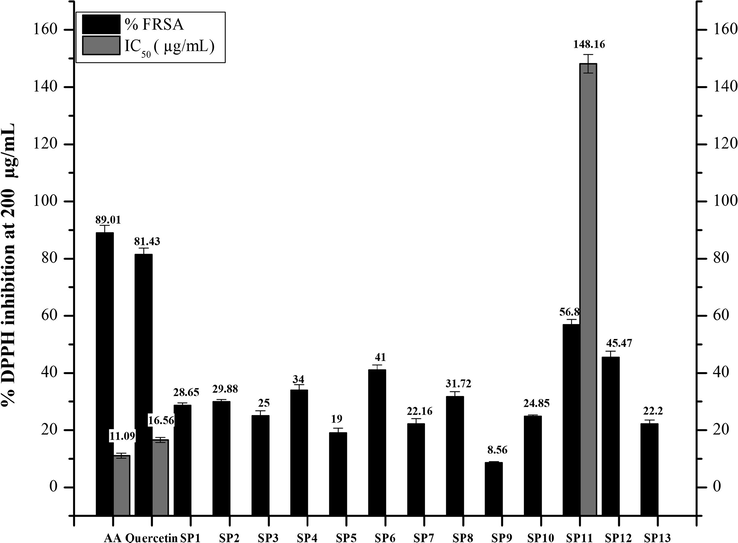
Graphical representation of DPPH Assay estimation of the synthesized compounds (SP1-SP13). Values given are expressed as the mean of triplicate ± standard deviation.
Initially the compounds antioxidant potential was assessed at 200 µg/mL. All the synthetic compounds showed moderate to good activity against DPPH free radical. SP11 showed the maximum inhibition of DPPH radical up to 56.8%. SP12 showed % inhibition for up to 45.47% followed by SP6 (41%), SP4 (34%), SP2 (29.88%) and SP1 (28.65%). The least antioxidant potential was showed by SP9 for up to 8.56%. Among the synthetic library, SP11 was further tested on 66.66, 22.22, and 7.40 µg/mL concentrations to determine its IC50 value, which was found out to be 148.16 ± 2.81 µg/mL. The standards, ascorbic acid, and quercetin showed the % inhibition at IC50 of 11.09 ± 0.06 and 16.56 ± 0.03 µg/mL, respectively.
The normal oxygen consumption in the body leads to the production of different free radicals. When the natural antioxidant defense system of the body is compromised, these free radicals accumulate and interact with the biological system in a cytotoxic manner and can cause damage to the genomic matter in cells, proteins, enzyme (Barbuceanu et al., 2014) and play an important role in the pathogenesis of many diseases such as coronary heart diseases, neurodegenerative disorders, aging, diabetes and different types of tumors (Ismaili et al., 2008; Torreggiani and Tamba, 2005). The reducing features of different organic compounds make them very important antioxidants. The incorporation of -OH and OCH3 groups in the benzene ring is responsible for good antioxidant activity (Rakesh et al., 2015). P-anisidine ring incorporated in SP11 is responsible to exhibit good antioxidant activity against DPPH free radicals. In general, higher antioxidant activity is related to the basic nature of the nitrogen atom. The higher the basicity of the nitrogen atom, the higher will be the activity (Hayun et al., 2018).
2.3.1.2 Estimation of total antioxidant capacity (TAC) and total reducing power (TRP)
The synthetic compounds were further evaluated to determine their antioxidant potential by total antioxidant capacity (TAC) and total reducing power (TRP) methods. The ascorbic acid standard curve is used to calculate the TAC and TRP results, shown in Fig. 2.4.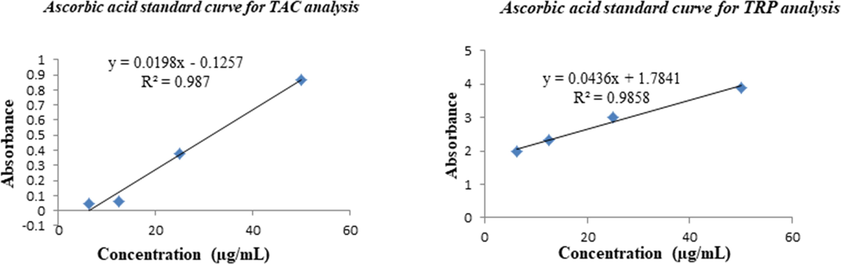
Ascorbic acid calibration curves (y = 0.0198x − 0.1257, R2 = 0.987) for total antioxidant capacity (TAC) and (y = 0.0436x + 1.7841, R2 = 0.9858) for total reducing power (TRP) estimations.
Values of standards at different concentrations are presented in Fig. 2.5.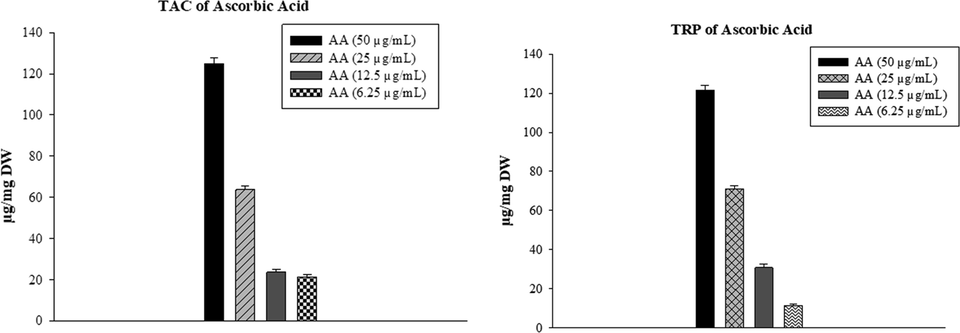
Standard (Ascorbic acid) TAC and TRP estimation.
All of the compounds showed good activity in the TAC assay. The highest TAC was observed by SP11 at 115.3 ± 2.64 µg AAE/mg bearing p-anisidine moiety followed by SP9 with TAC values of 79 ± 2.3 µg AAE/mg. All the other compounds showed moderate activity in the TAC assay. Ascorbic acid showed TAC activity of 125 ± 2.63 µg AAE/mg.
A TRP assay was performed to evaluate the reducing potential of synthetic compounds. For ascorbic acid, the value of TRP was observed at 121 ± 2.43 µg AAE/mg. only SP11 and SP13 showed significant activity is TRP assay at a value of 109.17 ± 2.81 µg AAE/mg and 60.32 ± 1.99 µg AAE/mg, respectively. Ascorbic acid, used as standard has a TRP value of 121 ± 2.43 µg AAE/mg. The results of these assays are plotted parallel to one another in Fig. 2.6.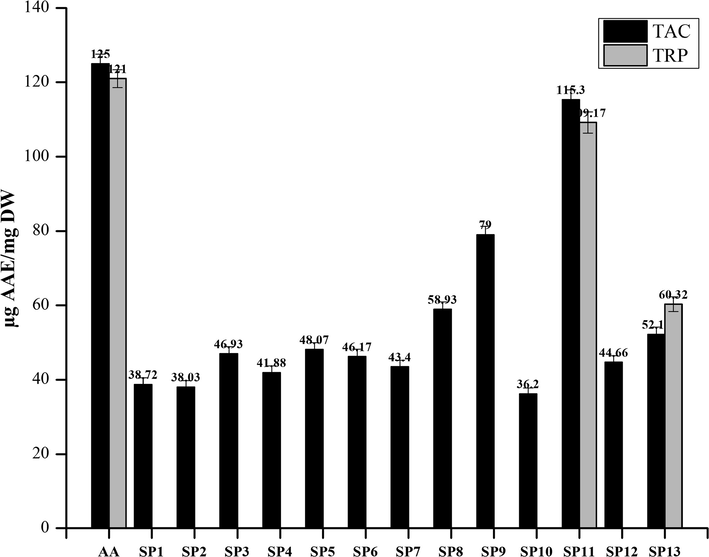
Graphical representation of TAC and TRP estimation of Library compounds (SP1-SP13). Values given are expressed as the mean of triplicate ± standard deviation.
A TRP assay is based on the antioxidant potential of the compounds to neutralize or react with the react free radicals generated while performing the assay. The antioxidants act by reducing the Fe3+ to Fe2+ (Lee et al., 2015). Compounds substituted with hydroxyl or methoxyl groups (p-anisidine in SP11 and acetaminophen in SP13) are reported to be good antioxidants (Rakesh et al., 2015). The potential of compounds to act as antioxidants is based on different factors i.e. the chemical environment, the nature of oxidants and antioxidants, reaction mechanism, reaction conditions, and medium. That’s the reason for many compounds being active antioxidants in one assay and inactive in another assay (Santos-Sánchez et al., 2019).
2.3.2 Enzyme inhibition evaluation
2.3.2.1 α-Amylase enzyme inhibition assay
α-Amylase is the key enzyme to regulate blood glucose levels. By inhibiting this enzyme, sugar levels can be monitored and maintained within range in patients with diabetes. The inhibitory potential of the newly synthesized compounds was evaluated at different concentrations (200, 66.66, 22.2, and 7.40 µg/mL) summarized in Table 2.2.
Serial #
Compounds
α-Amylase % enzyme inhibition at different Concentrations
IC50 1µg/mL
200 µg/mL
66.6 µg/mL
22.22 µg/mL
7.40 µg/mL
1
SP1
42.47 ± 0.24
32.33 ± 0.21
25.31 ± 0.42
18.74 ± 0.46
257.95 ± 1.07
2
SP2
94.02 ± 0.36
71.11 ± 0.31
55.78 ± 0.33
42.21 ± 0.38
9.20 ± 0.48
3
SP3
46.67 ± 0.32
31.21 ± 0.22
24.44 ± 0.23
17.67 ± 0.32
218.06 ± 1.52
4
SP4
44.94 ± 0.21
36.77 ± 0.24
24.45 ± 0.41
18.91 ± 0.22
225.15 ± 1.07
5
SP5
42.23 ± 0.19
30.98 ± 0.25
21.32 ± 0.32
18.74 ± 0.31
256.90 ± 0.51
6
SP6
22.44 ± 0.18
15.34 ± 0.19
9.87 ± 0.19
6.76 ± 0.21
553.64 ± 0.70
7
SP7
29.04 ± 0.17
20.98 ± 0.21
11.56 ± 0.28
4.54 ± 0.17
370.78 ± 0.34
8
SP8
94.27 ± 0.42
72.22 ± 0.25
55.65 ± 0.37
41.11 ± 0.06
10.25 ± 0.43
9
SP9
47.23 ± 0.21
28.81 ± 0.18
20.44 ± 0.23
10.34 ± 0.10
208.81 ± 1.10
10
SP10
34.47 ± 0.16
27.89 ± 0.16
15.64 ± 0.21
11.21 ± 0.13
321.79 ± 1.09
11
SP11
57.58 ± 0.24
40.93 ± 0.21
33.21 ± 0.33
21.89 ± 0.18
145.06 ± 1.00
12
SP12
95.44 ± 0.35
74.00 ± 0.27
54.33 ± 0.47
39.32 ± 0.23
13.81 ± 0.90
13
SP13
38.83 ± 0.22
24.72 ± 0.17
17.39 ± 0.33
9.89 ± 0.11
274.01 ± 0.99
14
Blank
0
0
0
0
–
15
Acarbose
87.89 ± 0.34
71.00 ± 0.31
53.10 ± 0.22
41.00 ± 0.21
13.52 ± 0.19
The alpha-amylase enzyme is involved in the breakage of α-1, 4 glycosidic linkages of long-chain carbohydrates to oligosaccharides i.e., glucose, maltose and dextrin, which serve as an energy source to the body (Gupta et al., 2003; Taha et al., 2019). Alpha glucoside is involved in the breakdown of disaccharides (Naeem et al., 2018). Other types of enzymes are also involved in the breakdown of starch but α-amylase plays an important role to start the amylolytic process (Tangphatsornruang et al., 2005). Thus by inhibiting these enzymes can prevent carbohydrates breakdown into disaccharides and oligosaccharides which in turn helps to maintain the blood glucose level or post-prandial hyperglycemia (Naeem et al., 2018). Among the tested compounds, SP2 showed the maximum % enzyme inhibition of 94.02 ± 0.2% at 200 µg/mL. SP8 and SP12 showed enzyme inhibition of 94.27 ± 0.42% and 95.44 ± 0.35%, respectively. The results of these compounds are comparable to the standard (acarbose) i.e., 87.89 ± 0.34%. The IC50 values were calculated using the regression equation. SP2 and SP8 showed potent activity against the α-amylase enzyme at IC50 of 9.20 ± 0.48 µg/mL and 10.25 ± 0.43 µg/mL, respectively higher than the acarbose i.e. 13.52 ± 0.19 µg/mL. SP12 showed comparable results to standard (acarbose) i.e., 13.81 ± 0.90 µg/mL. The significant inhibitory effects exhibited by SP8 having bromine atom was due to the presence of an electronegative atom incorporated into the heterocyclic pharmacophore, which enhanced their biological activity. SP2, derivatized with morpholine amine also showed significant activity due to the presence of ether oxygen in morpholine, which draws electrons and making it electronegative. The literature survey suggests that Mannich bases derivatized with electronegative atoms or electron-withdrawing groups tend to have good activity against the alpha-amylase enzyme. Carbohydrazide Mannich bases substituted with electron-withdrawing groups showed maximum inhibition of alpha-amylase enzyme (Taha et al., 2019). The most potent activity of these compounds was might be due to the substitution of the bromine atom at para positions to the phenyl ring which resulted in maximum inhibition of this enzyme (Noreen et al., 2017). In another research, it was found out that derivatizing an indazole nucleus with an electronegative atom increased the antidiabetic potential of resultant compounds (Rafique et al., 2020).
2.3.3 Anti-microbial evaluation
2.3.3.1 Antibacterial assay
The antibacterial potential of newly synthesized imidazoline N-Mannich bases was explored against gram-positive and gram-negative bacterial strains. Compounds that have shown significant inhibition (≥50%) were considered active and evaluated further to determine their MIC value. The results of antibacterial activity and their MIC values are summarized in Table 2.3.
Compds.
% Inhibition against bacterial strain and minimum inhibitory concentration (MIC)a
Gram-positive
Gram-negative
S.aureus
MIC
(µg/mL)B.subtilis
MIC
(µg/mL)
E.coli
MIC
(µg/mL)
K. pneumoniae
MIC
(µg/mL)
P.aeruginosa
MIC
(µg/mL)
SP1
57 ± 1.2
33.33
14 ± 0.6
–
38 ± 1.4
–
59 ± 1.00
100
79 ± 1.6
100
SP2
58 ± 1.6
100
22 ± 0.9
–
28 ± 0.9
–
59 ± 1.00
100
76 ± 1.4
11.1
SP3
54 ± 1.5
100
28 ± 0.7
–
21 ± 0.9
–
65 ± 1.5
33.33
8 ± 1.8
11.1
SP4
48 ± 1.5
–
27 ± 0.9
–
24 ± 0.9
–
59 ± 1.00
100
38 ± 0.9
–
SP5
67 ± 1.2
100
33 ± 1.00
–
46 ± 1.4
–
62 ± 1.8
33.33
16 ± 1.00
–
SP6
69 ± 1.2
33.33
48 ± 1.5
–
74 ± 1.5
33.33
68 ± 1.3
33.33
76 ± 1.6
33.33
SP7
56 ± 1.8
100
32 ± 0.9
–
39 ± 1.2
–
56 ± 1.1
100
70 ± 1.5
33.33
SP8
64 ± 1.5
33.33
15 ± 0.9
–
38 ± 1.5
–
65 ± 1.5
33.33
78 ± 1.8
33.33
SP9
48 ± 1.2
–
35 ± 1.5
–
45 ± 1.1
–
60 ± 1.2
100
70 ± 1.5
33.33
SP10
65 ± 1.8
33.33
8 ± 0.7
–
41 ± 1.1
–
58 ± 1.00
100
75 ± 1.2
11.1
SP11
45 ± 1.5
–
15 ± 1.4
–
29 ± 1.8
–
56 ± 1.2
100
79 ± 1.8
11.1
SP12
57 ± 1.5
100
23 ± 1.5
–
26 ± 1.1
–
67 ± 1.8
100
76 ± 1.1
100
SP13
57 ± 1.9
100
39 ± 1.5
–
39 ± 1.4
–
61 ± 1.8
100
59 ± 1.1
100
Blank
NA
–
NA
–
NA
–
NA
–
NA
–
Cefixime
Roxithromycin
75 ± 1.7
3.70
88 ± 2.82
3.70
70 ± 1.45
11.1
76 ± 1.6
11.1
70 ± 1.43
11.1
78 ± 1.6
11.1
92 ± 2.45
3.70
70 ± 1.38
11.1
81 ± 1.8
11.1
67 ± 1.51
11.1
The results showed that all synthetic compounds can inhibit in vitro bacterial growth to some extent and their MIC value ranges from 100 µg/mL to 11.11 µg/mL. None of the synthetic compounds from the library showed any significant activity against the B.subtilis strain. Compounds exhibited a good antibacterial spectrum against S.aureus, K.pneumoniae, and P.aeruginosa. Only SP6 exhibited a significant response to gram-negative E.coli strain. SP1, SP6, SP8, and SP10 showed significant antibacterial activity against S.aureus at a MIC value of 33.33 µg/mL. SP3, SP5, SP6, SP8 showed better results at MIC value of 33.33 µg/mL against K.pneumoniae strain. SP2, SP3, SP10, and SP11 exhibited MIC value of 11.11 µg/mL against P.aeruginosa strain.
2.3.3.2 Antifungal assay
Imidazoline Mannich bases were investigated against five fungal strains to evaluate their antifungal activity. Clotrimazole was taken as a positive control. The compounds having shown ≥ 12 mm zone of inhibition were selected for MIC (minimum inhibitory concentration). The results of compounds in the antifungal assay are summarized in Table 2.4.
Compds.
Zone of inhibition (mm) and minimum inhibitory concentration (MIC)a
A. fumigatus
MIC
(μg/mL)F. solani
MIC
(μg/mL)Mucor
MIC
(μg/mL)A. flavus
MIC
(μg/mL)A. niger
MIC
(μg/mL)
SP1
NA
–
13 ± 1.4
10
NA
–
NA
–
NA
–
SP2
NA
–
NA
–
NA
–
NA
–
NA
–
SP3
9 ± 0.5
–
8 ± 0.5
–
NA
–
NA
–
NA
–
SP4
9 ± 0.5
–
8 ± 0.5
–
NA
–
NA
–
NA
–
SP5
6 ± 0.5
–
NA
–
NA
–
NA
–
NA
–
SP6
8 ± 1.00
–
NA
–
NA
–
NA
–
NA
–
SP7
NA
–
NA
–
NA
–
NA
–
NA
–
SP8
NA
–
NA
–
13 ± 1.4
9
NA
–
NA
–
SP9
NA
–
NA
–
NA
–
NA
–
NA
–
SP10
NA
–
NA
–
NA
–
NA
–
NA
–
SP11
7 ± 0.5
–
NA
–
NA
–
8 ± 0.5
–
NA
–
SP12
9 ± 0.5
–
NA
–
NA
–
8 ± 0.7
–
NA
–
SP13
NA
–
NA
–
7 ± 0.5
–
5 ± 0.5
–
NA
–
Blank
NA
–
NA
–
NA
–
NA
–
NA
–
Clotrimazole
19 ± 0.49
7 ± 0.31
20 ± 0.43
6 ± 0.28
16 ± 0.37
8 ± 0.26
23 ± 0.29
8 ± 0.25
28 ± 1.44
2.44 ± 0.91
SP1 exhibited good antifungal activity against F.solani strain at MIC value of 10 µg/mL. SP8 exhibited response against Mucor strain at MIC value of 9 µg/mL. SP3, SP4, SP5, SP6, SP11, and SP12 exhibited moderate antifungal activity against A.fumigatus. SP11, SP12, and SP13 showed activity against A.flavus strain. None of the compounds has shown any antifungal activity against A.niger strain.
2.3.4 Screening of compounds for cytotoxic evaluation
2.3.4.1 Brine shrimp lethality assay
The newly synthesized N-Mannich bases of the imidazoline moiety were evaluated to check their cytotoxicity. Brine shrimp nauplii were used to determine the cytotoxicity of the compounds. % Mortality of brine shrimps has a direct correlationship with the anti-cancer potential of compounds (El-Gohary and Shaaban, 2014). Artemia salina is reported to be similar to the mammalian type because of DNA-dependent RNA polymerase (Birndorf et al., 1975). All the synthetic compounds were tested against brine shrimp nauplii. Doxorubicin was used as positive control and its response is monitored at 160, 80, 40, and 20 µg/mL. The LD50 data of the standard is also presented in Fig. 2.7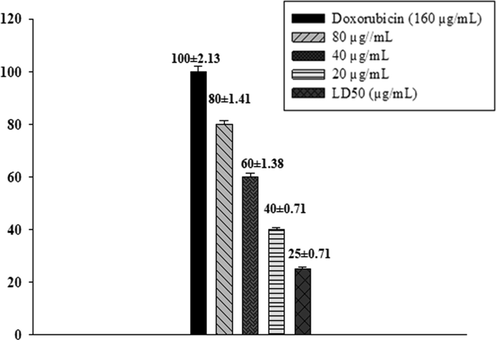
Doxorubicin % Mortality at different concentrations and IC50 value.
The Mannich bases showed good to moderate cytotoxicity against brine shrimp larvae. The compounds were tested at concentrations of 400, 200, 100, and 50 µg/mL. The results of the brine shrimp assay are presented in Table 2.5. Values represented are the mean of triplicate ± SD. DMSO was applied as a negative control.
Compds.
% Mortality (Concentrations: µg/mL)
LD50 (µg/mL)
400
200
100
50
SP1
100 ± 0.70
80 ± 2.12
60 ± 0.70
30 ± 1.21
89.82
SP2
30 ± 1.43
20 ± 1.34
10 ± 0.70
5 ± 1.23
667.00
SP3
90 ± 1.41
70 ± 0.70
55 ± 1.45
35 ± 1.87
100.94
SP4
30 ± 2.1
20 ± 2.1
15 ± 1.21
10 ± 1.21
757.70
SP5
40 ± 1.11
30 ± 1.42
15 ± 1.44
5 ± 1.23
474.76
SP6
30 ± 1.41
20 ± 1.41
15 ± 1.71
5 ± 0.70
693.08
SP7
35 ± 0.907
15 ± 0.70
10 ± 0.70
5 ± 1.23
587.96
SP8
95 ± 1.43
60 ± 1.24
45 ± 1.23
35 ± 1.35
135.87
SP9
30 ± 1.98
20 ± 1.22
10 ± 1.22
5 ± 1.21
667.00
SP10
20 ± 1.91
15 ± 1.91
10 ± 1.41
5 ± 0
1125
SP11
85 ± 1.44
70 ± 1.22
45 ± 0.98
35 ± 0.70
125.80
SP12
100 ± 0.707
75 ± 1.41
65 ± 1.41
40 ± 1.34
56.84
SP13
90 ± 1.23
70 ± 1.21
50 ± 0.67
35 ± 1.41
112.75
DMSO
0
0
0
0
–
The most potent effect was exhibited by SP12 at LD50 of 56.84 µg/mL. SP1, SP3, SP13, and SP11 showed significant activity at LD50 of 89.82, 100.94, 112.75, and 125.80 µg/mL, respectively. All the other compounds did not show any significant response against larvae and are considered to be non-cytotoxic.
The activity was concentration-dependent and the percent mortality rate decreased with a decrease in sample concentration which is in agreement with previous cytotoxic studies employing brine shrimp as a test subject (Khan et al., 2014). SP1, having piperidine derivative showed better activity against brine shrimp nauplii. Quaternary Mannich bases derivatized with piperidine moiety are reported to have good cytotoxicity against brine shrimps than the 5-fluorouracil (Gul et al., 2003). The introduction of the methoxy group greatly influences the anticancer activity of the compounds (Otevrel et al., 2010; Tugrak et al., 2017). SP11 (p-anisidine) and SP13 (acetaminophen) derivatives of heterocyclic scaffolds possessed appreciable activity against brine shrimps.
2.3.4.2 % cell viability determination in macrophages
MTT assay was performed to determine the % cell viability of the synthetic compounds. Peritoneal macrophages were extracted from rats in the laboratory. The isolated macrophages were then treated with different concentrations of the compounds i.e., 100, 50, 10, and 1 µM. Results are presented as % inhibition in cell viability in Table 2.6.
Synthetic Library
% Inhibition in cell viability at different concentrations of synthetic compounds
IC50 (µM) 1
100 µM
50 µM
10 µM
1 µM
SP1
24 ± 0.05
18 ± 0.03
7 ± 0.04
2 ± 0.01
213.11
SP2
22 ± 0.12
15 ± 0.005
7 ± 0.11
2 ± 0.09
241.61
SP3
62 ± 0.01
53 ± 0.01
43 ± 0.01
28 ± 0.03
40.63
SP4
32 ± 0.01
18 ± 0.04
12 ± 0.03
8 ± 0.06
183.93
SP5
44 ± 0.03
25 ± 0.02
14 ± 0.01
6 ± 0.08
119.96
SP6
75 ± 0.08
61 ± 0.07
48 ± 0.05
33 ± 0.02
15.45
SP7
75 ± 0.01
57 ± 0.02
38 ± 0.01
21 ± 0.04
37.03
SP8
64 ± 0.03
54 ± 0.01
38 ± 0.06
24 ± 0.04
46.32
SP9
60 ± 0.08
48 ± 0.04
23 ± 0.02
13 ± 0.04
69.00
SP10
33 ± 0.03
25 ± 0.04
14 ± 0.07
3 ± 0.04
177.74
SP11
46 ± 0.08
32 ± 0.08
24 ± 0.06
7 ± 0.04
118.40
SP12
66 ± 1.2
55 ± 0.91
43 ± 0.08
26 ± 0.07
34.96
SP13
77 ± 0.61
53 ± 0.32
42 ± 0.22
22 ± 0.31
34.65
1% DMSO in PBS
0
0
0
0
–
Standard (Doxorubicin)
82.21 ± 0.27
64.00 ± 0.32
45.10 ± 0.26
36.12 ± 0.43
25.22
Results showed a differential cytotoxicity profile for each of the compounds. All the compounds showed a dose-dependent response to macrophages. The most potent activity was observed for SP6 at IC50 value of 15.45 µM more than the standard i.e., 25.22 µM followed by SP13, SP12, SP7, SP3, and SP8 at IC50 of 34.65, 34.96, 37.03, 40.63, and 46.32 µM, respectively. The assay only helps to establish a positive correlation between the cytotoxic nature of the compound and its cell viability, but it is not solely considered to establish the anti-cancer profile of the compounds (Wiji Prasetyaningrum et al., 2018).
2.3.4.3 Cytotoxicity evaluation of synthetic library by MTT assay against HepG2 cell lines
Hepatocellular carcinoma cell lines (HepG2) were selected to check the anticancer potential of the synthetic compounds based on brine shrimp and cell viability test results. Three compounds were selected from the thirteen synthesized compounds. SP1, SP3, SP11, SP12, and SP13 showed significant activity against brine shrimp larvae at least LD50 value. SP3, SP6, SP7, SP8, SP12, and SP13 exhibited significant response against macrophages in % cell viability assay and showed the least IC50 values. From the above findings, it was concluded that SP3, SP12, and SP13 exhibited significant and potent response against both assays. All the other compounds either showed good response in brine shrimp assay or MTT assay and vice versa.
Compounds were screened for cytotoxicity HepG2 cells at 50, 25, 12.5, and 6.25 µM concentrations for 24, 48, and 72 h and analyzed by MTT assay. It was observed that all compounds significantly reduced the viability of HepG2 cells except the parent nucleus (2-phenyl-2-imidazoline i.e., 2-PI). All the compounds demonstrated a time-dependent increase in the cytotoxic response of compounds where the maximum effect was detected after 72 h treatment.
All of these compounds were greater than 50% cytotoxic against aggressive HepG2 cells after 24 h treatment (Table 2.7). SP3 was a more effective cytotoxic agent as compared with other compounds. The IC50 values for SP3, SP12, and SP13 were 14.66, 43.10, and 35.55 µM, respectively. The cytotoxicity was not much different at 48 and 72 h with some exceptions as shown in Table 2.8 and 2.9. Overall cytotoxicity ranged between 50 and 94% for these compounds.
No
Compounds
% Cytotoxicity 1
50
25
12.5
6.25
IC50
1
SP3
77.80 ± 0.04
69.70 ± 0.06
51.30 ± 0.03
33.60 ± 0.06
14.66
2
SP12
52.30 ± 0.01
41.90 ± 0.05
32.20 ± 0.05
17.70 ± 0.04
43.10
3
SP13
66.60 ± 0.04
35.80 ± 0.03
27.60 ± 0.03
16.60 ± 0.03
35.55
4
2-PI
47 ± 0.04
43 ± 0.01
38 ± 0.02
27 ± 0.02
52.46
5
1% DMSO in PBS
0
0
0
0
–
No.
Compounds
% Cytotoxicity 1
50
25
12.5
6.25
IC50
1
SP3
85.50 ± 0.04
70.50 ± 0.04
52.60 ± 0.05
37.60 ± 0.03
12.25
2
SP12
84.40 ± 0.03
70.50 ± 0.06
58.32 ± 0.04
41 ± 0.01
8.50
3
SP13
78 ± 0.01
53.11 ± 0.03
45 ± 0.02
36 ± 0.03
20.21
4
2-PI
73.40 ± 0.02
56.70 ± 0.02
50.20 ± 0.01
38.60 ± 0.06
17.01
5
1% DMSO in PBS
0
0
0
0
–
No
Compounds
% Cytotoxicity 1
50
25
12.5
6.25
IC50
1
SP3
90.80 ± 0.04
76.90 ± 0.04
55.60 ± 0.03
50.80 ± 0.04
3.64
2
SP12
93.40 ± 0.05
76.00 ± 0.06
61 ± 0.04
52 ± 0.03
1.17
3
SP13
94.50 ± 0.02
72 ± 0.03
58 ± 0.06
46 ± 0.03
6.91
4
2-PI
80.60 ± 0.02
65.60 ± 0.03
54.70 ± 0.03
43.60 ± 0.02
9.49
5
1% DMSO in PBS
0
0
0
0
–
Compounds exhibited the following IC50 profile against HepG2 cells: SP3 demonstrated IC50 values of 14.66, 12.25, and 3.64 µM at 24, 48, and 72 h, respectively. There was a gradual reduction of IC50 values with respect to the duration of exposure of cells to treatment. Similarly, SP12 demonstrated IC50 values of 43.10, 8.50, and 1.17 µM at 24, 48, and 72 h, respectively. IC50 values of 35.55, 20.21, and 6.91 µM were observed for SP13 at 24, 48, and 72 h, respectively. The results of cytotoxicity is plotted in the Figure below (Fig. 2.8).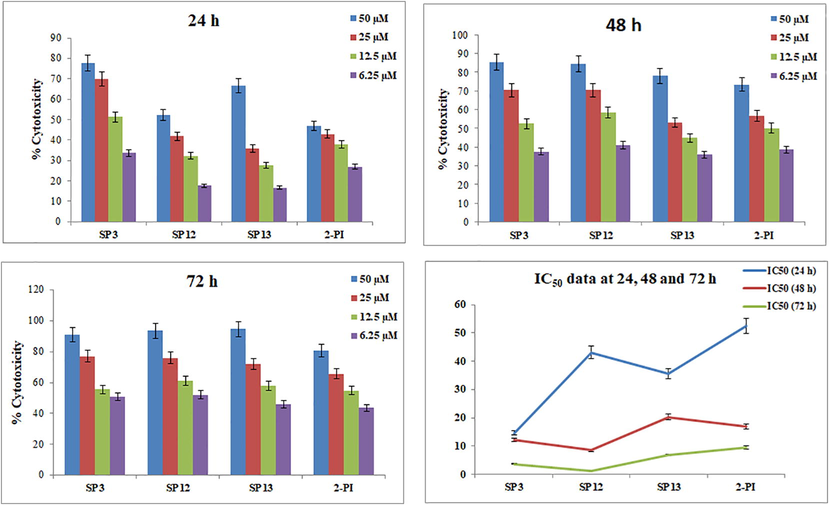
A 3-(4, 5-dimethylthiazol-2-yl)-2, 5-diphenyltetrazolium bromide (MTT) spectrophotometric assay of compounds (SP3, SP12, SP13, 2-PI) at 50, 25, 12.5 and 6.25 µM concentration in Hep-G2 cells. Data are reported as mean ± SEM of each compound tested in triplicate.
2.3.5 Anti-inflammatory evaluation
2.3.5.1 Nitric oxide scavenging assay
To screen out the potential anti-inflammatory compounds from the newly synthesized imidazoline derivatives, in vitro nitric oxide (NO) scavenging assay was used. Griess reagent method is used to determine the nitrite level in the conditioned medium of LPS (lipopolysaccharide). Sodium nitrite was used as a standard and from the standard curve nitrite concentration was calculated by using the regression equation in Fig. 2.9 (Farooq et al., 2020).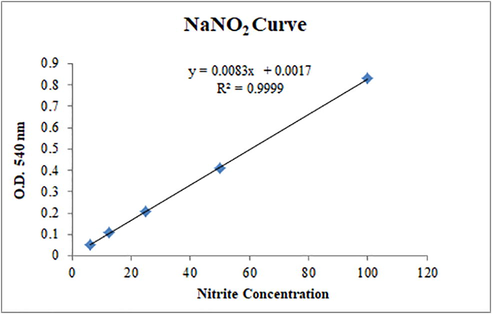
NaNO2 standard curve used to calculate NO concentration.
The synthetic compounds were analyzed at 100, 50, 10, and 1 µM concentrations. The compounds showed a concentration-dependent response in terms of inhibition of NO production. The results of the assay are summarized in Table 2.10.
Compounds
% NO (Nitric oxide) production at different concentrations (µM)
(Mean ± SEM) 1
100 µM
50 µM
10 µM
1 µM
SP1
35.23 ± 0.09
40.96 ± 0.11
44.0.22 ± 0.09
50.66 ± 0.09
SP2
34.83 ± 0.07
38.40 ± 0.11
40.22 ± 0.09
58.26 ± 0.16
SP3
20.42 ± 0.8
35.85 ± 0.15
37.65 ± 0.23
39.67 ± 0.13
SP4
50.52 ± 0.06
67.80 ± 0.04
87.19 ± 0.12
93.74 ± 0.43
SP5
27.34 ± 0.03
32.31 ± 0.04
40.96 ± 0.07
42.86 ± 0.05
SP6
31.65 ± 0.03
33.55 ± 0.01
50.58 ± 0.04
55.62 ± 0.03
SP7
29.04 ± 0.05
32.19 ± 0.04
38.26 ± 0.06
41.33 ± 0.07
SP8
31.11 ± 0.06
32.93 ± 0.06
35.79 ± 0.09
40.67 ± 0.08
SP9
24.16 ± 0.04
32.19 ± 0.08
35.54 ± 0.06
43.83 ± 0.08
SP10
26.23 ± 0.04
30.69 ± 0.03
47.34 ± 0.11
51.82 ± 0.12
SP11
49.10 ± 0.08
55.31 ± 0.12
58.94 ± 0.14
65.43 ± 0.03
SP12
29.52 ± 0.05
35.23 ± 0.12
35.71 ± 0.10
36.76 ± 0.04
SP13
15.37 ± 0.01
18.85 ± 0.05
23.91 ± 0.03
28.87 ± 0.02
Negative (LPS)
100
100
100
100
Piroxicam
17.32 ± 0.01
19.43 ± 0.02
23.11 ± 0.02
28.39 ± 0.01
From the results summarized in Table 2.10, it was cleared that all the synthetic compounds exhibited good to moderate activity in scavenging nitric oxide in vitro. SP3, SP12, and SP13 showed maximum inhibition of nitric oxide in a concentration-dependent manner. The results of all these compounds were compared to standard i.e. piroxicam. SP5, SP7, SP8, and SP9 also exhibited good response in scavenging the NO radical. It could be speculated from the results of the NO assay that these compounds have the potential to manage and treat inflammatory disorders. N-Mannich bases were further evaluated to determine theirs in vivo anti-inflammatory response.
2.3.5.2 In-vivo anti-inflammatory assay
Nitric oxide scavenging assay facilitated in screening out of compounds for in vivo anti-inflammatory study. Out of 13 synthesized N-Mannich bases, three were selected for in vivo study based on their significant % inhibition in NO production. These three Mannich bases were also reported to have significant cytotoxic potential. SP3, SP12, and SP13 were selected for in vivo study.
A dose optimization study was conducted to select the dose for performing the assay. 0.1, 1, and 10 mg/kg dose were chosen against 10 mg/kg dose of standard (acetylsalicylic acid). The compounds showed a marked decrease in paw thickness at 10 mg/kg (Fig. 2.10). From Fig. 2.10, it was confirmed that at 0.1 and 1 mg/kg dose, compounds did not show any marked reduction in paw edema.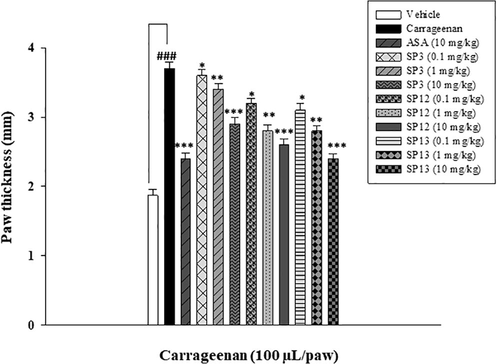
Dose-optimization study of the compounds at 0.1, 1, and 10 mg/kg i.p. carrageenan-induced acuteinflammatory model in mice (n = 5). The data are described as Mean ± SEM (standard error of the mean), */**/*** indicates p < 0.05, p < 0.01 and p < 0.001, respectively. ### indicates a significant difference from the carrageenan treated group.
Subcutaneous injection of carrageenan into the right-hand paw of mice resulted in acute inflammation of the paw. Compounds at a concentration of 10 mg/kg showed anti-inflammatory activity by inhibiting the acute phase of inflammation (Kuropakornpong et al., 2020). SP12 and SP13 exhibited significant inhibitory effects at 4th and 6th h. It could be speculated that the inhibitory mechanism of action may be due to inhibition of nitric oxide production (NO). NO is a key mediator of inflammation. It acts by stimulating prostaglandins that result in the production of proinflammatory mediators (Chhetri et al., 2020) that released after 1 h after carrageenan administration (Kuropakornpong et al., 2020). Derivatization of acetaminophen with imidazoline nucleus in SP13 could be a reason for the enhanced effect of SP13 in inhibition of paw edema. Acetaminophen is reported to have anti-inflammatory potential by inhibiting iNOS gene expression (Ryu et al., 2000). The results are summarized in Table 2.11.
Serial No.
Compounds
Time after carrageenan injection 1
0 h
2 h
4 h
6 h
Paw edema
1
Vehicle
2.04 ± 0.07
2.05 ± 0.06
2.07 ± 0.04
2.10 ± 0.02
2
Carrageenan (100 µL/paw)
2.11 ± 0.07
2.57 ± 0.08###
2.75 ± 0.07###
2.86 ± 0.05###
3
Acetylsalicylic acid (10 mg/kg)
2.08 ± 0.08
2.19 ± 0.05***
2.26 ± 0.04***
2.31 ± 0.02***
4
SP3 (10 mg/kg)
2.06 ± 0.01
2.24 ± 0.03***
2.31 ± 0.04***
2.48 ± 0.06***
5
SP12 (10 mg/kg)
2.06 ± 0.01
2.33 ± 0.03***
2.52 ± 0.05***
2.72 ± 0.07***
6
SP13 (10 mg/kg)
2.05 ± 0.03
2.36 ± 0.06***
2.48 ± 0.04***
2.59 ± 0.06***
SP3, having pyrrolidine showed better activity in the anti-inflammatory assay. The acute anti-inflammatory response of pyrrolidine in paw edema assay is further supported from the literatute. Pyrrolidine dithiocarbamate (PDTC) was tested on animal models to determine its response in acute and chronic inflammation. It was concluded that PDTC has the potential to attenuate the development of acue and chronic inflammation (Cuzzocrea et al., 2002).
2.4 Structure-activity relationship (SAR)
-
(1)
The 2-phenyl-2-imidazoline nucleus is essential for biological activity.
-
(2)
The methylene bridge is necessary for biological activity.
-
(3)
Position, type and nature of functional moiety plays a crucial role in defining the biological activity.
-
(4)
The hybridization of diphenylamine moiety into the 2-phenyl-2-imidazoline results in a decrease in lipophilicity.
-
(5)
The methoxy group attached to the phenyl ring is necessary for antioxidant activity.
-
(6)
Methyl piperazine moiety results in a decrease in antioxidant activity.
-
(7)
Electron-withdrawing groups i.e. ether oxygen in morpholine and bromine atom are important for enzyme inhibition activity. Electron-donating groups tend to have a decrease in activity against the alpha-amylase enzyme.
-
(8)
Incorporation of F, Br and CH3 groups to the aromatic ring results in an increase in activity against the amylase enzyme.
-
(9)
Conjugation of pyrrolidine, diethylamine and acetaminophen with the imidazoline scaffold results in an increase in cytotoxicity and important for activity against inflammation.
-
(10)
Halogen substitution tends to have influenced the anticancer potential of the tested compounds.
3 Materials and methodology
Unless otherwise noted, all commercially available compounds and solvents were used without further purification. Solvents for column chromatography were distilled before use. Analytical thin-layer chromatography (TLC) was performed with aluminum sheets, silica gel 60-F254 (Merck), and the products were visualized with UV irradiation (254 nm). Gallenkamp melting point apparatus (Sigma-Aldrich, Germany) was used to determine the melting points with open capillaries and are uncorrected. FTIR (PerkinElmer, Germany) was recorded by the KBr pellets method by the PerkinElmer spectrum using the attenuated total reflectance (ATR). Nuclear magnetic resonance (NMR) spectra were recorded on an Agilent VNMR 400 (1H NMR: 400 MHz, 13C NMR: 101 MHz) or an Agilent VNMR 600 (1H NMR: 600 MHz, 13C NMR: 151 MHz) spectrometer. The chemical shifts are given in parts per million (ppm) relative to the residual solvent peak of the non-deuterated solvent (CDCl3: 1H NMR: δ = 7.26 ppm; 13C NMR: δ = 77.00 ppm; DMSO‑d6: 1H NMR: δ = 2.50 ppm; 13C NMR: δ = 39.52 ppm). The multiplicity was reported with the following abbreviations: s = singlet, d = doublet, t = triplet, m = multiplet, p = pentet, br = broad signal, dd = doublet of doublet, dt = doublet of triplet, ddt = doublet of doublet of triplet, td = triplet of doublet, tp = triplet of pentet, tdd = triplet of doublet of doublet, and coupling constants were given in Hertz (Hz). Mass spectra were recorded on a Finnigan SSQ 7000 spectrometer and the resulting signals are given according to their m/z values. The PE 2400 Series II CHNS/O Analyzer was used to determine the content of carbon, hydrogen, and nitrogen in organic materials.
3.1 General procedure for the synthesis of N-Mannich bases (SP1-SP13) and their physiochemical and characterization parameters
3.1.1 Procedure for the synthesis of compounds (SP1, SP2, SP3, SP10, and SP11)
In a pressure tube equipped with a magnetic stirrer, 2-phenyl-2-imidazoline P (1.0 equiv, 0.5 mmol), 37% formalin solution S (2.0 equiv, 1 mmol), and secondary amines (1.0 equiv, 0.5 mmol) were taken and 5 mL of ethanol was added into the pressure tube and the mixture was heated at 80 °C for 24 h. The reaction progress and the completion of the reaction was initially monitored with the TLC system (EtOAc: Pentane: Triethylamine in 3:2:0.5 ratio) and later on with NMR. The reaction was cooled at room temperature and the product was isolated and purified by flash column chromatography (FCC) by using EtOAc: Pentane: Triethylamine in 3:2:0.5 ratios. The compounds synthesis and their structures along with their yield were described in Fig. 3.1.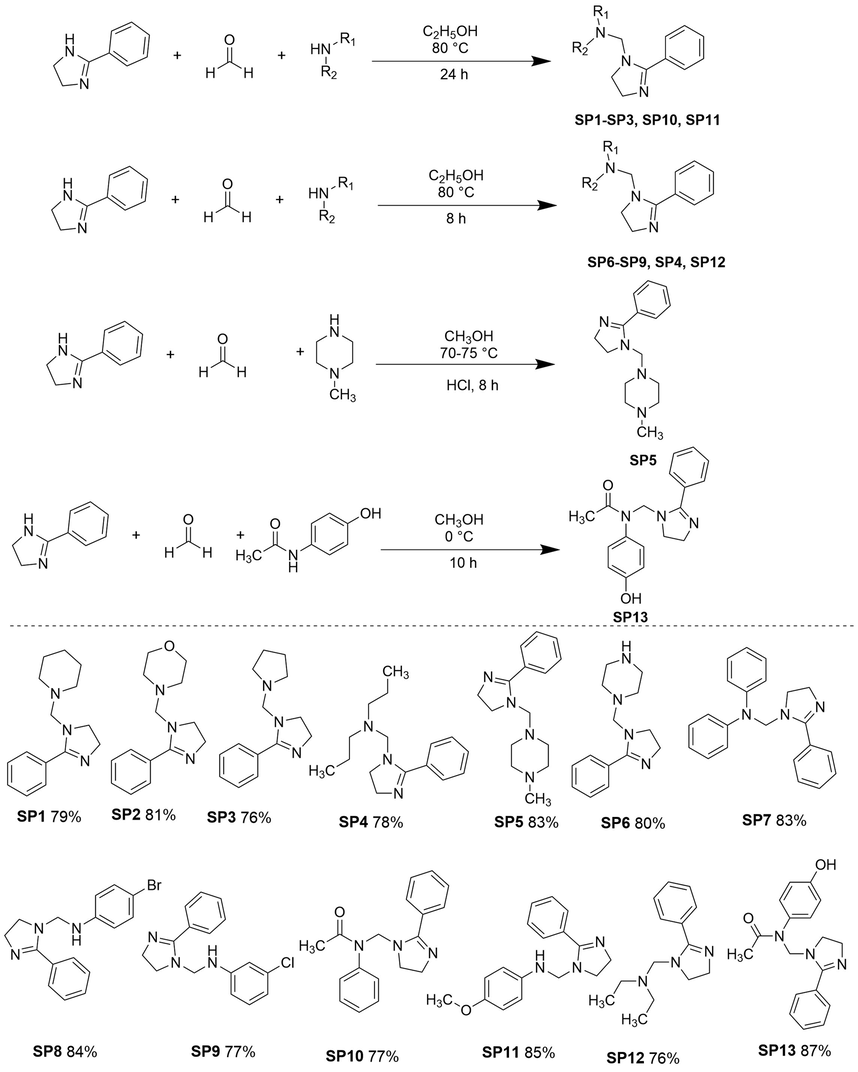
Synthesis of compounds SP1SP13. Reaction conditions: P (1.0 equiv), S (2.0 equiv), 113 (1.0 equiv); 5mL solvent. Yields obtained after product purification.
3.1.1.1 1-((2-Phenyl-4, 5-dihydro-1H-imidazol-1-yl) methyl) piperidine (SP1)
Brown powder; Yield 79%; m.p. 201–206 °C; Rf = 0.78; IR (ATR) υmax 3850, 3434, 3095, 2524, 2107, 1907, 1610, 1459, 1364, 1202, 1080, 86 cm−1; 1H NMR (400 MHz, CDCl3) δ ppm 7.57 – 7.54 (m, 1H), 7.45 – 7.35 (m, 4H), 3.90 (t, J = 10.0 Hz, 2H), 3.77 (s, 2H), 3.64 (s, 2H), 2.36 – 2.34 (m, 4H), 1.54 (s, 4H), 1.43 (s, 2H); 13C NMR (101 MHz, CDCl3) δ ppm 164.71, 130.46, 129.61, 128.47, 126.96, 64.21, 53.42, 53.08, 50.91, 25.94, 24.23; EIMS m/z 243.17 (M+); Anal. (C15H21N3): C 74.03, H 8.70, N 17.27, Calcd. C 74.06, H 8.73, N 17.23.
3.1.1.2 4-((2-Phenyl-4, 5-dihydro-1H-imidazol-1-yl) methyl) morpholine (SP2)
White shiny powder; Yield 81%; m.p. 204–212 °C; Rf = 0.81 ; IR (ATR) υmax 3856, 3433, 3096, 2682, 2103, 2001, 1812, 1721, 1610, 1364, 1201, 1001, 951 849 cm−1;1H NMR (400 MHz, CDCl3) δ ppm 7.54 (dd, J = 7.5, 2.0 Hz, 2H), 7.45 – 7.34 (m, 3H), 3.91 (t, J = 9.9 Hz, 2H), 3.69 (dd, J = 4.8, 2.1 Hz, 6H), 3.62 – 3.55 (m, 2H), 2.42 – 2.39 (m, 4H); 13C NMR (101 MHz, CDCl3) δ ppm 166.76, 129.81, 128.39, 128.32, 67.00, 66.83, 53.43, 51.99, 50.82; EIMS m/z 245.33 (M+); Anal. (C14H19N3O): C 68.54, H 7.81, N 17.13, Calcd. C 68.55, H 7.82, N 17.11.
3.1.1.3 2-Phenyl-1-(pyrrolidin-1-ylmethyl)-4, 5-dihydro-1H-imidazole (SP3)
Yellow paste; Yield 76%; m.p. 177–180 °C; Rf = 0.83 ; IR (ATR) υmax 3312, 2968, 2095, 1908, 1814, 1613, 1545, 1366, 1286, 1165, 1035, 951, 851 cm−1;1H NMR (400 MHz, CDCl3) δ ppm 7.62 – 7.59 (m, 2H), 7.53 – 7.49 (m, 1H), 7.45 – 7.41 (m, 2H), 5.82 (t, J = 7.0 Hz, 2H), 4.43 (s, 2H), 3.72 (t, J = 7.0 Hz, 2H), 2.63 – 2.57 (m, 4H), 1.86 – 1.78 (m, 4H); 13C NMR (101 MHz, CDCl3) δ ppm 164.71, 130.72, 130.26, 128.47, 126.99, 60.39, 21.05, 14.20; EIMS m/z 229.15 (M+); Anald. (C14H19N3): C 73.32, H 8.35, N 18.32, Calcd. C 73.33, H 8.33, N 18.35.
3.1.1.4 N-Phenyl-N-((2-phenyl-4, 5-dihydro-1H-imidazol-1-yl) methyl) acetamide (SP10)
Yellow crystals; Yield 77%; m.p. 270–285 °C; Rf = 0.91; IR (ATR) υmax 3434, 3097, 2896, 2573, 2425, 1604, 1495, 1283, 1283, 1033, 952, cm−1; 1H NMR (400 MHz, CDCl3) δ ppm 7.56 – 7.48 (m, 4H), 7.42 (s, 1H), 7.39 – 7.21 (m, 6H), 7.09 – 7.05 (m, 1H), 4.61 (s, 2H), 3.63 (dq, J = 21.4, 7.1 Hz, 2H), 2.07 (s, 3H); 13C NMR (101 MHz, CDCl3) δ ppm 169.08, 165.21, 138.30, 130.24, 129.69, 128.81, 128.30, 124.04, 120.02, 77.43, 77.11, 76.79, 57.99, 52.74, 52.59, 24.19; EIMS m/z 293.37 (M+); Anal. (C18H19N3O): C 73.69, H 6.53, N 14.32, Calcd. C 73.70, H 6.51, N 14.21.
3.1.1.5 4-Methoxy-N-((2-phenyl-4, 5-dihydro-1H-imidazol-1-yl) methyl) aniline (SP11)
Black paste; Yield 85%; m.p. 281–287 °C; Rf = 0.91; IR (ATR) υmax 3435, 3099, 2955, 2832, 1616, 1507, 1448, 1366, 1285, 1237, 1030, 941, 912 cm−1; 1H NMR (600 MHz, CDCl3) δ ppm 7.66 – 7.64 (m, 2H), 7.53 – 7.49 (m, 1H), 7.45 – 7.41 (m, 2H), 6.72 – 6.70 (m, 2H), 6.61 – 6.59 (m, 2H), 5.82 (t, J = 7.0 Hz, 2H), 5.13 (s, 2H), 4.35 (s, 1H), 3.80 (s, 3H), 3.72 (t, J = 7.0 Hz, 2H); 13C NMR (151 MHz, CDCl3) δ ppm 153.09, 152.83, 140.80, 130.13, 129.88, 128.35, 127.05, 114.88, 114.71, 55.61, 55.54, 52.86, 50.03; EIMS m/z 281.15 (M+); Anal. (C17H19N3O): C 72.57, H 6.81, N 14.94, Calcd. C 72.56, H 6.81, N 14.93.
3.1.2 Procedure for the synthesis of compounds (SP4, SP6, SP7, SP8, SP9, and SP12)
In a pressure tube equipped with a magnetic stirrer, 2-phenyl-2-imidazoline P (1.0 equiv, 0.5 mmol), 37% formalin solution S (2.0 equiv, 1 mmol), and secondary amines (1.0 equiv, 0.5 mmol) were taken and 5 mL of ethanol was added into the pressure tube and the mixture was heated at 80 °C for 8 h. The reaction progress and the completion of the reaction was initially monitored with the TLC system (EtOAc: Pentane: Triethylamine in 3:2:0.5 ratio) and later on with NMR. The reaction was cooled at room temperature and the product was isolated and purified by flash column chromatography (FCC) by using EtOAc: Pentane: Triethylamine in 3:2:0.5 ratios (Fig. 3.1).
3.1.2.1 N-((2-Phenyl-4, 5-dihydro-1H-imidazol-1-yl) methyl)-N-propylpropan-1-amine (SP4)
Yellow powder; Yield 78%; m.p. 191–196 °C; Rf = 0.81; IR (ATR) υmax 3430, 3097, 2970, 2107, 1614, 1494, 1365, 1286, 1035, 1002, 951 cm−1;1H NMR (400 MHz, CDCl3) δ ppm 7.47 – 7.44 (m, 2H), 7.36 – 7.28 (m, 3H), 4.08 (s, 2H), 3.82 (t, J = 10.0 Hz, 2H), 3.73 (s, 2H), 2.35 – 2.30 (m, 4H), 1.42 – 1.29 (m, 4H), 0.80 – 0.76 (m, 6H); 13C NMR (101 MHz, CDCl3) δ ppm 166.95, 130.50, 129.55, 128.36, 128.19, 77.38, 77.07, 76.75, 63.16, 57.72, 53.42, 51.93, 20.29, 11.77; EIMS m/z 259.40 (M+); Anal. (C16H25N3): C 74.09, H 9.71, N 16.20, Calcd. C 74.10, H 9.71, N 16.23.
3.1.2.2 1-((2-Phenyl-4, 5-dihydro-1H-imidazol-1-yl) methyl) piperazine (SP6)
White powder; Yield 80%; m.p. 260–265 °C; Rf = 0.73 ; IR (ATR) υmax 3392, 2937, 2795, 2322, 2159, 1635, 1546, 1346, 1282, 1164, 1010, 830, 919 cm−1; 1H NMR (400 MHz, CDCl3) δ ppm 7.48 (ddd, J = 9.3, 5.7, 2.0 Hz, 2H), 7.36 – 7.33 (m, 1H), 7.31 (s, 2H), 3.99 (d, J = 3.9 Hz, 2H), 3.62 – 3.40 (m, 6H), 2.44 (s, 1H), 2.38 (t, J = 5.0 Hz, 2H), 1.16 – 1.09 (m, 4H); 13C NMR (101 MHz, CDCl3) δ ppm 166.84, 130.65, 129.78, 128.45, 127.01, 63.22, 58.01, 53.37, 51.31, 49.15; EIMS m/z 244.25 (M+); Anal. (C14H20N4): C 68.82, H 8.25, N 22.93, Calcd. C 68.82, H 8.26, N 22.91.
3.1.2.3 N-Phenyl-N-((2-phenyl-4, 5-dihydro-1H-imidazol-1-yl) methyl) aniline (SP7)
Yellow powder; Yield 83%; m.p. 280–286 °C; Rf = 0.88; IR (ATR) υmax 3434, 3312, 2966, 2681, 2103, 1915, 1606, 1495, 1367, 1277, 1034, 944, 785 cm−1; 1H NMR (400 MHz, CDCl3) δ ppm 7.34 – 7.20 (m, 4H), 7.17 (ddd, J = 8.6, 7.3, 2.2 Hz, 5H), 7.03 – 6.89 (m, 6H), 6.85 – 6.81 (m, 2H), 4.48 (s, 2H), 3.72 – 3.63 (m, 2H); 13C NMR (101 MHz, CDCl3) δ ppm 143.20, 130.20, 130.09, 129.33, 128.40, 128.36, 120.93, 117.80, 58.09, 52.87, 52.73; EIMS m/z 327.17 (M+); Anal. (C22H21N3): C 80.70, H 6.46, N 12.83. Calcd. C 80.71, H 6.47, N 12.83.
3.1.2.4 4-Bromo-N-((2-phenyl-4, 5-dihydro-1H-imidazol-1-yl) methyl) aniline (SP8)
Light yellow powder; Yield 84%; m.p. 300–307 °C; Rf = 0.89; IR (ATR) υmax 3432, 3098, 2960, 2681, 2313, 2111, 1750, 1609, 1491, 1382, 1272, 1081, 1003, 872 cm−1; 1H NMR (600 MHz, CDCl3) δ ppm 7.65 – 7.62 (m, 2H), 7.53 – 7.49 (m, 1H), 7.45 – 7.41 (m, 2H), 7.19 – 7.17 (m, 2H), 6.54 – 6.52 (m, 2H), 5.82 (t, J = 7.0 Hz, 2H), 5.13 (s, 2H), 4.65 (s, 1H), 3.72 (t, J = 7.0 Hz, 2H); 13C NMR (151 MHz, CDCl3) δ ppm 165.02, 145.34, 131.74, 130.31, 130.10, 128.84, 127.02, 116.72, 110.16, 54.67, 52.92, 48.92; EIMS m/z 330.23 (M+); Anal. (C16H16BrN3): C 58.19, H 4.88, N 12.72, Calcd. C 58.21, H 4.88, N 12.71.
3.1.2.5 3-Chloro-N-((2-phenyl-4, 5-dihydro-1H-imidazol-1-yl) methyl) aniline (SP9)
Yellow powder; Yield 77%; m.p. 272–279 °C; Rf = 0.79; IR (ATR) υmax 3317, 2107, 1891, 1602, 1497, 1244, 1035, 984, 824 cm−1; 1H NMR (400 MHz, CDCl3) δ ppm 7.77 (dt, J = 7.0, 1.5 Hz, 1H), 7.55 – 7.40 (m, 3H), 7.12 – 7.03 (m, 2H), 6.77 – 6.72 (m, 2H), 6.68 – 6.51(m, 3H), 4.74 (s, 1H), 3.76 (s, 2H), 3.24 (s, 2H); 13C NMR (101 MHz, CDCl3) δ ppm 165.05, 147.71, 134.82, 130.58, 130.23, 130.13, 128.78, 127.03, 115.38, 114.93, 113.55, 54.21, 52.93, 50.07; EIMS m/z 285.78 (M+); Anal. (C16H16ClN3): C 67.25, H 5.64, N 14.70, Calcd. C 67.23, H 5.64, N 14.70.
3.1.2.6 N-ethyl-N-((2-phenyl-4, 5-dihydro-1H-imidazol-1-yl) methyl) ethanamine (SP12)
White paste; Yield 76%; m.p. 163–169 °C; Rf = 0.82; IR (ATR) υmax 3314, 2973, 2109, 1908, 1815, 1615, 1494, 1452, 1366, 1286, 1036, 951 cm−1; 1H NMR (600 MHz, CDCl3) δ ppm 7.62 – 7.59 (m, 2H), 7.53 – 7.49 (m, 1H), 7.45 – 7.41 (m, 2H), 5.82 (t, J = 7.0 Hz, 2H), 4.43 (s, 2H), 3.72 (t, J = 7.0 Hz, 2H), 2.53 (q, J = 6.3 Hz, 4H), 1.05 (t, J = 6.3 Hz, 6H); 13C NMR (151 MHz, CDCl3) δ ppm 164.70, 130.60, 128.43, 128.38, 126.95, 58.17, 53.45, 50.16, 44.30, 11.81; EIMS m/z 231.17 (M+); Anal. (C14H21N3): C 72.69, H 9.15, N 18.16, Calcd. C 72.68, H 9.15, N 18.17.
3.1.3 Procedure for the synthesis of compound SP5
In a pressure glass tube equipped with a magnetic stirrer, N-methyl piperazine (1.0 equiv, 0.5 mmol), formaldehyde S (2.0 equiv, 1 mmol), and 2-phenyl-2-imidazoline P (1.0 equiv, 0.5 mmol) were taken and 5 mL of methanol was added into the pressure tube and the mixture was heated at 80 °C for ∼ 8 h with constant stirring. 5 mol % HCl was added as a catalyst. The reaction progress and completion were monitored with the TLC system (Ethyl acetate: Pentane: Triethylamine in 3: 2: 0.5 ratios). The reaction was cooled at room temperature and neutralized with NaHCO3 solution and extracted with ethyl acetate (3 × 10 mL). The organic layer was dried over MgSO4 and evaporated at reduced pressure. The product was purified by flash column chromatography (FCC) by using ethyl acetate: pentane: TEA in 3: 2: 0.5 ratios (Fig. 3.1).
3.1.3.1 1-Methyl-4-((2-phenyl-4, 5-dihydro-1H-imidazol-1-yl) methyl) piperazine (SP5)
White powder; Yield 83%; m.p. 226–233 °C; Rf = 0.86; IR (ATR) υmax 3435, 3096, 2959, 2681, 2101, 1621, 1546, 1367, 1286, 1080, 1035, 854 cm−1; 1H NMR (600 MHz, CDCl3) δ ppm 7.62 – 7.59 (m, 2H), 7.53 – 7.49 (m, 1H), 7.45 – 7.41 (m, 2H), 5.82 (t, J = 7.0 Hz, 2H), 4.43 (s, 2H), 3.72 (t, J = 7.0 Hz, 2H), 2.51 – 2.47 (m, 8H), 2.24 (s, 3H); 13C NMR (151 MHz, CDCl3) δ ppm165.23, 131.57, 129.63, 128.79, 128.61, 69.48, 54.83, 54.44, 52.68, 50.78, 45.62; EIMS m/z 258.18 (M+); Anal. (C15H22N4): C 69.73, H 8.58, N 21.69, Calcd. C 69.71, H 8.57, N 21.68.
3.1.4 Procedure for the synthesis of compound SP13
In a pressure glass tube equipped with a magnetic stirrer, acetaminophen (1.0 equiv, 0.5 mmol), formaldehyde S (2.0 equiv, 1 mmol), and 2-phenyl-2-imidazoline P (1.0 equiv, 0.5 mmol) were taken and 5 mL of methanol was added into the pressure tube and the mixture was run at 0 °C for ∼ 10 h with constant stirring. The reaction progress and completion were monitored with the TLC system (Ethyl acetate: Pentane: Triethylamine in 3: 2: 0.5 ratios). The product was purified by flash column chromatography (FCC) by using ethyl acetate: pentane: TEA in 3: 2: 0.5 ratios (Fig. 3.1).
3.1.4.1 N-(4-hydroxyphenyl)-N-((2-phenyl-4, 5-dihydro-1H-imidazol-1-yl) methyl) acetamide (SP13)
Maroonish paste; Yield 87%; m.p. 301–309 °C; Rf = 0.89; IR (ATR) υmax 3099, 2971, 2105, 1716, 1611, 1507, 1451, 1366, 1168, 1037, 952, 830 cm−1; 1H NMR (600 MHz, CDCl3) δ ppm 9.95 (s, 1H), 7.69 – 7.66 (m, 2H), 7.53 – 7.49 (m, 1H), 7.45 – 7.41 (m, 2H), 7.00 – 6.97 (m, 2H), 6.91 – 6.88 (m, 2H), 5.82 (t, J = 6.8 Hz, 2H), 5.45 (s, 2H), 3.72 (t, J = 6.8 Hz, 2H), 2.01 (s, 3H); 13C NMR (151 MHz, CDCl3) δ ppm 128.52, 127.00, 122.25, 115.78; EIMS m/z 310 (M+); Anal. (C18H19N3O2): C 69.88, H 6.19, N 13.58, Calcd. C 69.87, H 6.19, N 13.58.
The target compounds SP1-SP13 were synthesized and listed in Fig. 3.1 below.
3.2 ADME predictions and pharmacokinetic profiling of synthetic compounds
An in silico study was conducted to predict the pharmacokinetic parameters (absorption, distribution, metabolism, excretion) of the synthetic compounds using SwissADME prediction software available online (Availabe online) to determine the compound's drug-likeness behavior.
3.3 Biological evaluation of synthetic compounds
3.3.1 Antioxidant evaluation
3.3.1.1 % Free radical scavenging assay (DPPH Assay)
The % free radical scavenging assay of the synthetic library compounds was performed by using the method described by Farooq et al. (Farooq et al., 2020). Synthetic compounds (10 µL) were taken in a 96-well plate at a final concentration of 200 µg/mL and 190 µL of DPPH reagent was added to this. The plate was incubated at 37 °C for 60 min in dark. DMSO and ascorbic acid were taken as negative and positives, respectively. The absorbance was measured at 515 nm by using a microplate reader. The % FRSA was calculated by using the following formula:
% scavenging activity = (1 − Abs/Abc) × 100
Samples were further tested to calculate IC50 value by using three-fold serial dilutions of 200 µg/mL, 66.6 µg/mL, 22.2 µg/mL, and 7.4 µg/mL. The assay was performed in triplicate and the results were presented as mean ± SD.
3.3.1.2 Estimation of total antioxidant capacity (TAC) and total reducing power (TRP)
The TAC assay was determined by using the phosphomolybdenum-based method (Bibi et al., 2011). A reagent solution comprising of 4 mM ammonium molybdate, 28 mM sodium phosphate, and 0.6 M sulphuric acid was used. The method is based on the reduction of Mo (VI) to Mo (V), leading to the formation of a green-colored phosphate molybdenum complex that gives absorption at 630 nm. In 96-well plates, 20 µL of the sample was added with 180 µL TAC reagents and incubated at 95 °C for 90 min in a water bath and cooled at room temperature.
The TRP assay was performed by using the protocol described by (Farooq et al., 2020) with slight modifications. 100 µL of test samples, 200 μL of phosphate buffer, and 250 µL of 1% potassium ferricyanide (K3Fe CN)6) were taken in an Eppendrof tube and their incubation was done at 50 °C for 20 min. Two hundred microliter of 10% trichloroacetic acid (TCA) was added to the mixture. The mixture was centrifuged at 3000 RPM for 10 min and 150 µL of supernatant was transferred to microplate with FeCl3 (50 μL, 0.1%). The absorbance was taken at 700 nm. Ascorbic acid was used as a standard (positive control) and DMSO as blank (negative control). The test was performed in triplicate. The results were calculated as µg AAE/mg.
3.3.2 Enzyme inhibition assay
3.3.2.1 α-Amylase enzyme inhibition assay
Enzyme inhibition assay was performed by the method described by (Farooq et al., 2020). In a 96-well plate, the test samples were added to a final concentration of 200 µg/mL. To this well plate, α-amylase enzyme solution (25 µL), starch (40 µL), and phosphate buffer (15 µL) were added. The plate was incubated and later on, HCl and iodine solution were added. DMSO and acarbose were taken as negative and positive controls, respectively. the absorbance was measured at 540 nm. % Inhibition in activity was calculated by the following formula:
% Enzyme inhibition = [(As − An) ÷ (Ab − An] × 100
Synthetic compounds with a % enzyme inhibition ≥ 50% were taken at three-fold concentrations of 200 µg/mL, 66.6 µg/mL, 22.2 µg/mL, and 7.4 µg/mL and their IC50 was calculated using the regression equation.
3.3.3 Anti-microbial assay
3.3.3.1 Antibacterial assay
The Microtitre plate method was used to evaluate the antibacterial potential of synthetic compounds. Initially, the master plate was prepared by taking 20 μL of the test samples, 10 μL DMSO and 80 μL nutrient broth into a 96-well plate. The sample plate was prepared from the master plate by taking 5 μL from the master plate and pouring 195 μL nutrient broth having bacterial strain in it. (Sarker et al., 2007). Samples that exhibited ≥ 50% growth inhibition were analyzed further for the determination of MIC (Gao et al., 2012). Three folds serial dilution of concentration 100 µg/mL was prepared, the subsequent wells containing 33.33, 11.11, and 3.70 µg/mL, respectively. Bacterial inoculum was added to each well while inoculum size and the density was adjusted as per predetermined limits (up to 1 × 10⁸ CFU/mL). After incubating the plate at 37 °C for 30 min, a zero time reading was taken at 600 nm using a microplate reader. It was followed by 24 h incubation at 37 °C, absorbance was recorded again and the difference between the two readings (net change in turbidity) was calculated. Percent growth inhibition was estimated using the following formula:
% growth inhibition = Ts / Tc × 100
3.3.3.2 Antifungal assay
The synthetic compounds were evaluated against five fungal strains. The Agar disc diffusion method was selected for the preliminary screening of synthetic compounds against fungal strains. Clotrimazole was served as positive while DMSO as a negative control. Separate Petri plates having sterile SDA (2025 mL) were swabbed with an aliquot of 100 µL spore suspension from each fungal strain harvested in 0.02% (v/v) Tween 20 solution. On sterile filter paper discs, test samples (4 mg/mL) were applied and the discs were placed on the seeded agar plates. Plates were incubated at 37 °C for 24-48 h with the periodic observation of inhibition zones (Farooq et al., 2020).
3.3.4 Screening of compounds for cytotoxic evaluation
3.3.4.1 Brine shrimp lethality assay
Brine shrimp lethality assay was performed by the method (Farooq et al., 2020). In a 96-well plate, artificial seawater (150 µL) and 10 nauplii were added. Test samples (400, 200, 100, and 50 µg/mL) were taken into each well and the final volume was made up by adding the artificial seawater. The well plate was left uncovered under a lamp. The number of surviving shrimps were counted and recorded after 24 h. The test was repeated in triplicate. Using GraphPad Prism, the lethality concentration (LD50) was assessed at 95% confidence intervals. Doxorubicin and DMSO were used as a positive and negative control, respectively. The percentage mortality (%M) was also calculated by the following formula:
% Mortality = No. of dead shrimps / Total no. of shrimps × 100
3.3.4.2 % cell viability determination in Macrophages
The % cell viability of the test samples was assessed using an MTT assay (Khan et al., 2011). Macrophages were plated at a density of 1 × 10⁶ per well in a 96-well plate in a 5% CO2 incubator at 37 °C. The cells were treated with various concentrations of the test compounds (100 µM, 50 µM, 10 µM, and 1 µM) or vehicle alone. After 24 h of incubation, 20 µL of MTT (1 mg/mL in normal saline) was added into each well and incubated under the same conditions for 2 h. Mitochondrial succinate dehydrogenase converted MTT in live cells into purple formazan crystals. The formazan crystals were then solubilized in 100 µL of the solubilizing agent (DMSO), and the absorbance was measured at 570 nm. Doxorubicin and 1% DMSO in PBS were taken as positive and negatives, respectively.
The % cell viability was calculated by the following formula; % cell viability = (abssample − absblank) ÷ (abscontrol − absblank) × 100
IC50 values were calculated using the regression equation
3.3.4.3 Cytotoxicity evaluation of synthetic library by MTT assay against HepG2 cells
Cytotoxicity against HepG2 cells was determined by MTT assay. Non-adherent HepG2 cells were grown in complete growth medium RPMI 1640 supplemented with 2.2 g/L NaHCO3, 10% v/v heat-inactivated fetal bovine serum (HIFBS), 100 μg/mL streptomycin sulfate, 100 IU/mL penicillin G sodium, and 0.25 μg/mL amphotericin B in a humidified CO2 incubator at 37 °C. For cytotoxicity on cancer cells, 20 μL of samples in 1% DMSO in PBS and 180 μL of cancer cells were mixed in a 96-well plate to achieve the final concentration of (50 µM, 25 µM, 12.5 µM, and 6.25 µM). The cells were added at an assay density of 1 × 10⁶ cells/mL. The plate was incubated in humidified 5% CO2 at 37 °C for 24, 48, and 72 h. Later, 10 μL of pre-filter sterilized MTT solution was added in plates and incubated in a CO2 incubator at 37 °C for 4 h. Colored formazan crystals were separated by carefully removing the supernatant and dissolved in 100 μL of DMSO and absorbance was measured at 570 nm (Zhang et al., 2018). The % cytotoxicity was calculated by the following formula: % Cytotoxicity = [100-(As ÷ Ac *100)]
Where As represents the absorbance of sample and Ac, absorbance of the negative control. IC50 values were calculated using the regression equation.
3.3.5 Anti-inflammatory evaluation
3.3.5.1 Nitric oxide scavenging assay
The nitric oxide (NO) scavenging activity of the test samples was evaluated in murine macrophages by using the Griess reagent method, described by (Farooq et al., 2020). Briefly, macrophages were plated in a 96-well plate at a density of 1 × 10⁶ and incubated in a 5% CO2 incubator at 37 °C for 24 h, pre-treated with different concentrations (100 µM, 50 µM, 10 µM, and 1 µM) of test samples compounds for another 2 h and challenged with LPS (1 µg/mL) for an additional 18 h. Equal volumes of Griess reagent (100 µL) and culture medium were mixed and the absorbance was taken at 540 nm. LPS was taken as a blank and piroxicam was taken as a positive control. The amount of nitrite in the media was calculated by the sodium nitrite (NaNO2) standard curve.
3.3.5.2 In vivo anti-inflammatory assay
A 3-5 weeks old, male BALB/C albino mice (22–25 g), were purchased from The National Institute of Health (NIH), Islamabad, Pakistan. Five animals were housed per group and placed in a controlled temperature and humidity-controlled room (22 °C and 66 ± 5%, respectively) in a 12 h light–dark cycle and provided with water and food ad libitum. Ethical approval was taken from the bio-ethical committee of Quaid-I-Azam University (Approval No. BEC-FBS-QAU 2019–131).
The in vivo anti-inflammatory bioassay was performed by using the carrageenan-induced mice paw edema method. Shortly, dose optimization studies were conducted at a dose of 0.1, 1, and 10 mg/kg against 100 µL carrageenan (1% solution in normal saline)/paw. Treatment was given 60 min before carrageenan injection. Readings were taken at 4 h post carrageenan injection (Farooq et al., 2020).
After optimizing the dose, test compounds, vehicle (saline with 2% DMSO) and drug (acetylsalicylic acid, ASA 10 mg/kg) were administered to the mice orally by gastric intubation 60 min before injecting carrageenan into the right hind paw. The decrease in edema was measured by vernier calipers every 2 h.
3.4 Statistical analysis
Statistical analysis of results from all experiments was done using GraphPad Prism 5. Data is presented in terms of means with either SEM or SD of individual replicates. Each test was performed in triplicate. Other analysis software and the number of observations are given with each experiment. Regression analysis was done to determine IC50 values. The results were statistically analyzed by t-tests and ANOVA at a 95% confidence level (p < 0.05).
4 Conclusions
The newly synthesized N-Mannich bases of the imidazoline moiety were characterized by spectroanalytical techniques and their physical data was obtained. The thirteen imidazoline derivatives were evaluated pharmacologically by performing bioassays. ADME studies were conducted by using an online tool and BOILED-Egg representation gives information about the p-gb substrate. All the compounds were completely following the Lipinski rule of five except SP7. The compounds showed moderate to good activity in all bioassays. SP11 and SP13 showed good activity in antioxidant assays against free radicals. SP2, SP8, and SP12 exhibited potent effect against α-amylase enzyme at IC50 value of 9.20 ± 0.48, 10.25 ± 0.43, and 13.81 ± 0.90 µg/mL, respectively. Compounds showed good to moderate activity against all bacterial and fungal strains. The compounds were selected for further analysis against hepatocellular carcinoma cell line (HepG2) based on LD50 and IC50 values obtained in brine shrimp and biocompatibility assay, respectively. SP3, SP12, and SP13 were evaluated at 24, 48, and 72 h against HepG2 cells. Maximum response was observed at 72 h. A dose-optimization study was conducted and in vivo anti-inflammatory activity was performed on SP3, SP12, and SP13 based on results obtained in vitro NO assay. In a conclusion, the present study gave us the chance for further research in these areas through the hybridization of functional groups to design and develop novel bioactive compounds and to establish a rational quantitative structure–activity.
Acknowledgments
Samra Farooq was financially supported by the Indigenous Ph.D. scholarship (PIN NO. 315-11229-2MD3-036) and the International Research Support Initiative Program (IRSIP) scholarship (PIN NO. IRSIP 43 BMS 83) granted by the Higher Education Commission (HEC) of Pakistan. The authors deeply acknowledge Prof. Carsten Bolm (RWTH Aachen University, Germany) for facilitating us with the equipment and assistant with the acquisition of characterization analysis.
Declaration of Competing Interest
The authors declare that they have no known competing financial interests or personal relationships that could have appeared to influence the work reported in this paper.
References
- The emergence and evolution of organic synthesis and why it is important to sustain it as an advancing art and science for its own sake. Isr. J. Chem.. 2018;58:104-113.
- [Google Scholar]
- The art and science of total synthesis at the dawn of the twenty-first century. Angew. Chem. Int. Ed.. 2000;39:44-122.
- [Google Scholar]
- Towards click chemistry: Multicomponent reactions via combinations of name reactions. Tetrahedron. 2018;74:3391-3457.
- [Google Scholar]
- The aldol addition reaction: an old transformation at constant rebirth. Chemistry–A. European Journal. 2002;8:36-44.
- [Google Scholar]
- Recent advances in the catalytic asymmetric nitroaldol (Henry) reaction. Eur. J. Org. Chem.. 2007;2007:2561-2574.
- [Google Scholar]
- Catalytic enantioselective formation of C− C bonds by addition to imines and hydrazones: A ten-year update. Chem. Rev.. 2011;111:2626-2704.
- [Google Scholar]
- Ueber ein kondensationsprodukt aus formaldehyd, ammoniak und antipyrin. Arch. Pharm.. 1912;250:647-667.
- [Google Scholar]
- Recent Progress on Catalytic Addition Reaction to N-Unsubstituted Imines. ACS Catal. 2020
- [Google Scholar]
- Frozen Solution-Mediated Asymmetric Synthesis: Control of Enantiomeric Excess. J. Org. Chem.. 2020;85:4525-4529.
- [Google Scholar]
- The direct catalytic asymmetric Mannich reaction. Acc. Chem. Res.. 2004;37:102-112.
- [Google Scholar]
- The direct catalytic asymmetric three-component Mannich reaction. J. Am. Chem. Soc.. 2000;122:9336-9337.
- [Google Scholar]
- Synthesis of some Mannich base derivatives and their antimicrobial activity study. Arabian J. Chem.. 2014;7:994-999.
- [Google Scholar]
- Intramolecular Mannich reactions. In: Comprehensive Organic Synthesis. Pergamon Oxford; 1991. p. :1007.
- [Google Scholar]
- Semisynthesis of novel magnolol-based Mannich base derivatives that suppress cancer cells via inducing autophagy. Eur. J. Med. Chem.. 2020;205:112663
- [Google Scholar]
- Synthesis, characterization and in vitro antimicrobial activity of some novel 5-substituted Schiff and Mannich base of isatin derivatives. J. Saudi Chem. Soc.. 2013;17:337-344.
- [Google Scholar]
- Conventional and microwave assisted synthesis of pyrazolone Mannich bases possessing anti-inflammatory, analgesic, ulcerogenic effect and antimicrobial properties. Bioorg. Med. Chem. Lett.. 2014;24:2940-2944.
- [Google Scholar]
- Synthesis and Characterizaton of some N-Mannich bases as potential antimicrobial, anthelmintic and insecticidal agents. Chem Sci Trans. 2012;1:431-439.
- [Google Scholar]
- Analgesic and antiinflammatory activities of some new Mannich bases of 5-nitro-2-benzoxazolinones. Arch. Pharmacal Res.. 2007;30:419-424.
- [Google Scholar]
- Design, synthesis, anticonvulsant, and antiarrhythmic properties of novel N-Mannich base and amide derivatives of β-tetralinohydantoin. Pharmacol. Rep.. 2016;68:886-893.
- [Google Scholar]
- Synthesis of bis-substituted amidinobenzothiazoles as potential anti-HIV agents. Heterocycles. 2001;55:2085-2098.
- [Google Scholar]
- Antitumor benzothiazoles. 8. Synthesis, metabolic formation, and biological properties of the C-and N-oxidation products of antitumor 2-(4-aminophenyl) benzothiazoles. J. Med. Chem.. 1999;42:4172-4184.
- [Google Scholar]
- Synthesis and antibacterial activity of some new 2-(substituted phenyl sulfonamido)-6-substituted benzothiazoles. Indian J. Heterocycl. Chem.. 2001;11:79-80.
- [Google Scholar]
- Synthesis of imidazole-based medicinal molecules utilizing the van leusen imidazole synthesis. Pharmaceuticals. 2020;13:37.
- [Google Scholar]
- A review on “Imidazoles”: Their chemistry and pharmacological potentials. Int J PharmTech Res. 2011;3:268-282.
- [Google Scholar]
- Heterocyclic chemistry of benzimidazoles and potential activities of derivatives. Int. J. Drug Res. Tech. 2011;1:26-32.
- [Google Scholar]
- Ueber die einwirkung des ammoniaks auf glyoxal. Justus Liebigs Annalen der Chemie. 1858;107:199-208.
- [Google Scholar]
- Marine natural products. Annual Reports Section“ B”(Organic Chemistry). 2009;105:150-166.
- [Google Scholar]
- Muscarine, imidazole, oxazole, and thiazole alkaloids. Nat. Prod. Rep.. 2011;28:1143-1191.
- [Google Scholar]
- Efficient imidazolium catalysts for the benzoin condensation. J. Chem. Res.. 2002;2002:262-263.
- [Google Scholar]
- Comprehensive review in current developments of imidazole-based medicinal chemistry. Med. Res. Rev.. 2014;34:340-437.
- [Google Scholar]
- Synthesis, antimicrobial and antiviral evaluation of substituted imidazole derivatives. Eur. J. Med. Chem.. 2009;44:2347-2353.
- [Google Scholar]
- Ketoconazole and other imidazole derivatives as inhibitors of steroidogenesis. Endocr. Rev.. 1986;7:409-420.
- [Google Scholar]
- Synthesis and antibacterial activities of new metronidazole and imidazole derivatives. Molecules. 2009;14:2431-2446.
- [Google Scholar]
- New derivatives of imidazole as potential anticancer agents. Il Farmaco. 1998;53:342-345.
- [Google Scholar]
- Novel tetracyclic imidazole derivatives: Synthesis, dynamic NMR study, and anti-inflammatory evaluation. J. Heterocycl. Chem.. 2010;47:640-656.
- [Google Scholar]
- D Bendagude, R.; S Kondawar, M. Synthesis and molecular modeling studies of novel 2, 4-disubstituted-1, 5-diphenyl-1-h-imidazole derivatives as potential anti-tubercular agents. Current Bioactive Compounds 2017, 13, 244-258.
- Synthesis and biological evaluation of triphenyl-imidazoles as a new class of antimicrobial agents. European J. Chem.. 2018;9:369-374.
- [Google Scholar]
- Recent advances in the synthesis of 2-imidazolines and their applications in homogeneous catalysis. Adv. Synth. Catal.. 2009;351:489-519.
- [Google Scholar]
- Imidazoline binding sites and their ligands: an overview of the different chemical structures. Med. Res. Rev.. 2004;24:639-661.
- [Google Scholar]
- Synthesis, antifungal and antimycobacterial activities of new bis-imidazole derivatives, and prediction of their binding to P45014DM by molecular docking and MM/PBSA method. Bioorg. Med. Chem.. 2007;15:7444-7458.
- [Google Scholar]
- Synthesis and antibacterial evaluation of some novel aminothiazole derivatives. Pharma Chemica. 2011;3:156-161.
- [Google Scholar]
- Imidazole and its biological activities: A review. Der Chemica Sinica. 2010;1:36-47.
- [Google Scholar]
- In-vivo analgesic and anti-inflammatory activities of newly synthesized benzimidazole derivatives. Eur. J. Med. Chem.. 2010;45:2048-2054.
- [Google Scholar]
- Synthesis and anticancer activity of some novel 2-substituted benzimidazole derivatives. Eur. J. Med. Chem.. 2010;45:2949-2956.
- [Google Scholar]
- Antiviral activity of benzimidazole derivatives. II. Antiviral activity of 2-phenylbenzimidazole derivatives. Bioorg. Med. Chem.. 2010;18:2937-2953.
- [Google Scholar]
- Synthesis of substituted aryloxy alkyl and aryloxy aryl alkyl imidazoles as antileishmanial agents. Bioorg. Med. Chem. Lett.. 2010;20:291-293.
- [Google Scholar]
- Shanmugasundaram, P.; Vijayakumar, B.; Devadass, G.; Reddy, A.A.; Aanandhi, M.V. SYNTHESIS AND BIOLOGICAL ACTIVITY OF NOVAL IMIDAZOLINE DERIVATIVES. 2009.
- Design, synthesis, and antimicrobial screening of novel pyridyl-2-amidrazone incorporated isatin mannich bases. J. Adv. Pharm. Technol. Res.. 2012;3:57.
- [Google Scholar]
- Aljamali, N.M.; Jwad, S.M.; Gafel, R.A.A. Review in Mannich Bases and Biological Activity. 2015.
- One-pot multicomponent synthesis of novel 3, 4-dihydro-3-methyl-2 (1H)-quinazolinone derivatives and their biological evaluation as potential antioxidants, enzyme inhibitors, antimicrobials, cytotoxic and anti-inflammatory agents. Arabian J. Chem.. 2020;13:9145-9165.
- [Google Scholar]
- One-Pot Multicomponent Synthesis and Bioevaluation of Tetrahydroquinoline Derivatives as Potential Antioxidants, α-Amylase Enzyme Inhibitors, Anti-Cancerous and Anti-Inflammatory Agents. Molecules. 2020;25:2710.
- [Google Scholar]
- Yehye, W.A.; Abdul Rahman, N.; A Alhadi, A.; Khaledi, H.; Ng, S.W.; Ariffin, A. Butylated hydroxytoluene analogs: Synthesis and evaluation of their multipotent antioxidant activities. Molecules 2012, 17, 7645-7665.
- Discovery and development of sorafenib: a multikinase inhibitor for treating cancer. Nat. Rev. Drug Discovery. 2006;5:835-844.
- [Google Scholar]
- Sorafenib decreases proliferation and induces apoptosis of prostate cancer cells by inhibition of the androgen receptor and Akt signaling pathways. Endocr. Relat. Cancer. 2012;19:305.
- [Google Scholar]
- Carboxylate derivatives of tributyltin (IV) complexes as anticancer and antileishmanial agents. DARU J. Pharm. Sci.. 2017;25:8.
- [Google Scholar]
- An assessment on the role of endophytic microbes in the therapeutic potential of Fagonia indica. Ann. Clin. Microbiol. Antimicrobials. 2017;16:53.
- [Google Scholar]
- Synthesis and antioxidant activity evaluation of new compounds from hydrazinecarbothioamide and 1, 2, 4-triazole class containing diarylsulfone and 2, 4-difluorophenyl moieties. Int. J. Mol. Sci.. 2014;15:10908-10925.
- [Google Scholar]
- Synthesis and antioxidant activity evaluation of new hexahydropyrimido [5, 4-c] quinoline-2, 5-diones and 2-thioxohexahydropyrimido [5, 4-c] quinoline-5-ones obtained by Biginelli reaction in two steps. Eur. J. Med. Chem.. 2008;43:1270-1275.
- [Google Scholar]
- Free radical scavenging and metal chelating activity of some therapeutic heterocyclic agents. Trends Heterocyclic Chem. 2005;10:115-137.
- [Google Scholar]
- Schiff’s bases of quinazolinone derivatives: synthesis and SAR studies of a novel series of potential anti-inflammatory and antioxidants. Bioorg. Med. Chem. Lett.. 2015;25:1072-1077.
- [Google Scholar]
- Synthesis, anti-inflammatory, and antioxidant activity of mannich bases of dehydrozingerone derivatives. J. Young Pharm.. 2018;10:S6.
- [Google Scholar]
- Determination of the total antioxidant capacity and quantification of phenolic compounds of different solvent extracts of black mustard seeds (Brassica nigra) Int. J. Food Prop.. 2015;18:2500-2507.
- [Google Scholar]
- Antioxidant compounds and their antioxidant mechanism. In: Antioxidants. IntechOpen; 2019.
- [Google Scholar]
- Microbial α-amylases: a biotechnological perspective. Process Biochem.. 2003;38:1599-1616.
- [Google Scholar]
- Thiazole based carbohydrazide derivatives as α-amylase inhibitor and their molecular docking study. Heteroat. Chem.. 2019;2019
- [Google Scholar]
- Synthesis, α-Amylase Inhibitory Activity and Molecular Docking Studies of 2, 4-Thiazolidinedione Derivatives. Open Chem. J.. 2018;5
- [Google Scholar]
- Isolation and characterization of an α-amylase gene in cassava (Manihot esculenta) Plant Physiol. Biochem.. 2005;43:821-827.
- [Google Scholar]
- Synthesis of alpha amylase inhibitors based on privileged indole scaffold. Bioorg. Chem.. 2017;72:248-255.
- [Google Scholar]
- Synthesis of new indazole based dual inhibitors of α-glucosidase and α-amylase enzymes, their in vitro, in silico and kinetics studies. Bioorg. Chem.. 2020;94:103195
- [Google Scholar]
- Antimicrobial and antiquorum-sensing studies. Part 2: synthesis, antimicrobial, antiquorum-sensing and cytotoxic activities of new series of fused [1, 3, 4] thiadiazole and [1, 3] benzothiazole derivatives. Med. Chem. Res.. 2014;23:287-299.
- [Google Scholar]
- DNA-dependent RNA-polymerases from Artemia embryos: Characterization of polymerases I and II from nauplius larvae. Dev. Biol.. 1975;45:34-43.
- [Google Scholar]
- Comparative study of green fruit extract of Melia azedarach Linn. with its ripe fruit extract for antileishmanial, larvicidal, antioxidant and cytotoxic activity. Am. J. Phytomed. Clin. Ther.. 2014;2:442-454.
- [Google Scholar]
- Toxicity of some bis Mannich bases and corresponding piperidinols in the brine shrimp (Artemia salina) bioassay. J. Appl. Toxicol. Int. J.. 2003;23:53-57.
- [Google Scholar]
- Investigating the spectrum of biological activity of ring-substituted salicylanilides and carbamoylphenylcarbamates. Molecules. 2010;15:8122-8142.
- [Google Scholar]
- Synthesis and anticancer properties of mono Mannich bases containing vanillin moiety. Med. Chem. Res.. 2017;26:1528-1534.
- [Google Scholar]
- Synthesis and cytotoxicity evaluation of novel asymmetrical mono-carbonyl analogs of curcumin (AMACs) against Vero, HeLa, and MCF7 Cell Lines. Sci. Pharm.. 2018;86:25.
- [Google Scholar]
- One-Pot Multicomponent Synthesis of novel 3, 4-Dihydro-3-methyl-2 (1H)-quinazolinone Derivatives and their Biological Evaluation as Potential Antioxidants, Enzyme inhibitors, Antimicrobials, Cytotoxic and Anti-inflammatory agents. Arabian J. Chem. 2020
- [Google Scholar]
- In Vitro and In Vivo Anti-Inflammatory Activities of Benjakul: A Potential Medicinal Product from Thai Traditional Medicine. In: Evidence-Based Complementary and Alternative Medicine 2020. 2020.
- [Google Scholar]
- Anti-Inflammatory, and Analgesic Activities of Aqueous Extract of Diploknema butyracea (Roxb.) HJ Lam Bark. Scientific World J. 2020
- [Google Scholar]
- Ryu, Y.S.; Lee, J.H.; Seok, J.H.; Hong, J.H.; Lee, Y.S.; Lim, J.H.; Kim, Y.M.; Hur, G.M. Acetaminophen inhibits iNOS gene expression in RAW 264.7 macrophages: differential regulation of NF-κB by acetaminophen and salicylates. Biochemical and biophysical research communications 2000, 272, 758-764.
- Pyrrolidine dithiocarbamate attenuates the development of acute and chronic inflammation. Br. J. Pharmacol.. 2002;135:496-510.
- [Google Scholar]
- Availabe online: http://swissadme.ch/index.php (accessed on 30-11-2020).
- Antitumor, cytotoxic and antioxidant potential of Aster thomsonii extracts. African J. Pharm. Pharmacol.. 2011;5:252-258.
- [Google Scholar]
- Microtitre plate-based antibacterial assay incorporating resazurin as an indicator of cell growth, and its application in the in vitro antibacterial screening of phytochemicals. Methods. 2007;42:321-324.
- [Google Scholar]
- Antimicrobial and antiprotozoal activities of secondary metabolites from the fungus Eurotium repens. Med. Chem. Res.. 2012;21:3080-3086.
- [Google Scholar]
- Suppression of LPS-induced inflammatory and NF-κB responses by anomalin in RAW 264.7 macrophages. J. Cell. Biochem.. 2011;112:2179-2188.
- [Google Scholar]
- Synthesis and biological evaluation of novel benzofuroxan-based pyrrolidine hydroxamates as matrix metalloproteinase inhibitors with nitric oxide releasing activity. Bioorg. Med. Chem.. 2018;26:4363-4374.
- [Google Scholar]
Appendix A
Supplementary material
Supplementary data to this article can be found online at https://doi.org/10.1016/j.arabjc.2021.103050.
Appendix A
Supplementary material
The following are the Supplementary data to this article:


