

Translate this page into:
The multicomponent characterization of Shuanghe decoction by dimension-enhanced data-independent HDMSE: Focusing on the performance comparison between MSE and HDMSE
⁎Corresponding authors at: College of Pharmaceutical Engineering of Traditional Chinese Medicine, Tianjin University of Traditional Chinese Medicine, 10 Poyanghu Road, Jinghai, Tianjin 301617, China. hs_yu08@163.com (Heshui Yu), lizheng@tjutcm.edu.cn (Zheng Li)
-
Received: ,
Accepted: ,
This article was originally published by Elsevier and was migrated to Scientific Scholar after the change of Publisher.
Abstract
The co-elution, pervasive isomers, and frequently occurring in-source fragmentation definitely hinder the comprehensive characterization of the multiple components from traditional Chinese medicine (TCM) by liquid chromatography/mass spectrometry. Herein, a dimension-enhanced strategy, by utilizing an ion mobility quadrupole time-of-flight mass spectrometer coupled to ultra-high performance liquid chromatography (UHPLC/IM-QTOF-MS) with the ability of offering four-dimensional information (retention time, Rt; drift time or collision cross section, CCS; accurate mass of precursors; and accurate MS2 product ions), is presented. Shuanghe Decoction (SHD) is a classic tonifying formula composed of nine herbs, however, little is known to its chemical complexity, hitherto. Good chromatographic separation was achieved on an HSS T3 column, and by the Vion™ IMS-QTOF high-resolution mass spectrometer, data-independent MSE and High-Definition MSE (HDMSE) in both the negative and positive electrospray ionization modes were employed for acquiring the collision-induced dissociation-MS2 data. A self-built database, including 642 known compounds, was established, which assisted to perform the automated peak annotation by UNIFI™. By reference to 55 compounds, totally 236 components were identified or tentatively characterized from SHD with 4D data recorded. The combination of negative and positive modes could yield more information complementary to structural elucidation. Compared with the conventional MSE, HDMSE exhibit of merits in the provision of CCS, better separation and detection those easily co-eluting components, and reduction of the false positives in the identification results. Conclusively, the combination of HDMSE acquisition, in-house library, and UNIFI-facilitated automated peak annotation, renders a potent approach dedicated to deconvoluting the chemical composition of complex systems like TCM formulae.
Keywords
Traditional Chinese medicine
Chemical profiling
Ion mobility quadrupole time-of-flight mass spectrometry
High-Definition MSE
Automated peak annotation

1 Introduction
Traditional Chinese medicine (TCM) formulae is composed of two or more different herbal medicines, used to treat, prevent, and diagnose diseases with a long history, which has received increasing attention around the world (Duan et al., 2017; Fu et al., 2019). The clinical efficacy of TCM has been attributed to the entirety action of intrinsic complexing components (Chen et al., 2019). In the process of TCM modernization, clarifying the inherent complex components is a key stage, which is beneficial to promote the development of pharmacology and the quality control of TCM (Xu et al., 2015). The chemicals in a formulae are significantly complex, featured by large spans of polarity, molecular mass and content (Xie et al., 2019, Wang et al., 2019; Wang et al., 2016). On the one hand, the co-elution and the pervasive isomers make separation and identification more difficult (Shan et al., 2012; Garran et al., 2019). On the other hand, in-source fragmentation (ISF) is a common phenomenon in ESI-based mass spectrometry (Gabelica et al., 2018; Godzien et al., 2015; Xu et al., 2015), which can lead to the inaccurate structural elucidation (Zhang et al., 2020). These are not conducive to the in-depth characterization of the chemicals involved and even the holistic evaluation of the quality for TCM formulae (Yao et al., 2015).
Modern analysis of TCM has been committed to continuously strengthening separation, detection and post-acquisition data processing techniques (Fekete et al., 2015, Zuo et al., 2019), aiming to comprehensively deconvolute the complexity of herbal medicine chemical composition (Zuo et al., 2020; Yao et al., 2017). LC/MS technology has become a common tool for the profiling of multicomponent in TCM, with higher resolution, sensitivity and accurate structural identification ability (Shaw et al., 2013; Zhou et al., 2018). On the one hand, data dependent acquisition (DDA) and data independent acquisition (DIA) (namely MSE) can obtain specific and reliable MSn scan information, which have been reported in support of the in-depth metabolite characterization (Wang et al., 2019, Jia et al., 2018; Zhang et al., 2019). On the other hand, the rapid development of dimension-enhanced technique can provide deep insights into the chemical complexity (Qian et al., 2021). Two-dimensional liquid chromatography has the advantages of extending peak capacity and enhancing selectivity (Yang et al., 2016). In addition, ion mobility (IM) is a separation technology, the ions migrating with characteristic mobility times (drift times) according to their different charge state, size and shapes as function of the collision cross section (CCS) (Chen et al., 2020). IM enabled LC/MS provides multiple degrees of orthogonal separation, which delivers unprecedented peak capacity over conventional LC/MS (Gabelica V et al., 2018). An effective high-definition DIA approach on UHPLC/IM-QTOF-MS, the combination of IM and MSE (HDMSE) (Li et al., 2019), enables up to three-dimensional separations (Pettit et al., 2018; Zuo et al., 2019) and generating 4D data associated with the structures of analytes (retention time, precursor accurate mass, accurate mass diagnostic product ions, and CCS) (Jones et al., 2019). There is no doubt that the isomers and co-fluids will be greatly separated and detected (Pettit et al., 2015; Wang et al., 2021). Some experiments have proved that HDMSE data acquisition is a potential approach to apply to drug metabolism studies, analysis of biological molecules and plant metabolomics of TCM, with excellent accuracy and quality (Mlynek et al., 2020; Zhang et al., 2020; Eldrid et al., 2020). Thus, it is feasible to establish the a non-targeted HDMSE method for the multicomponent characterization of TCM formulae and the analysis of the prototype components and metabolites in plasma to clarify the material basis and discover potential bioactive constituents.
The classical Shuanghe Decoction (SHD), a formulated Chinese herb medicine, was recorded in the Taiping Huimin Heji Ju Fang an ancient Chinese medical book. SHD is composed of 9 different herbs, including Paeoniae Radix Alba (Bai-Shao; PRA; Paeonia lactiflora), Angelicae Sinensis Radix (Dang-Gui; ASR; Angelica sinensis), Astragali Radix (Huang-Qi; AR; Astragalus membranaceus), Chuanxiong Rhizoma (Chuan-Xiong; CR; Ligusticum chuanxiong), Rehmanniae Radix (Di-Huang; RR; Rehmannia glutinosa), Glycyrrhizae Radix et Rhizome (Gan-Cao; GRR; Glycyrrhiza uralensis), Cinnamomi Ramulus (Rou-Gui; CR; Cinnamomum cassia), Jujubae Fructus (Da-Zao; JF; Ziziphus jujuba) and Zingiberis Rhizoma Recens (Sheng-Jiang; ZRR; Zingiber officinale). It has the benefits of “tonifying qi, nourishing blood, and harmonizing stomach”, which is traditionally used to treat insufficiency of qi and blood, enhance immunity and prevent diseases. Its products are widely exported to Japan, South Korea and other countries. Unfortunately, the in-depth chemical basis elucidation of SHD has not been reported, hitherto. Its quality and safety cannot be effectively controlled. Therefore, it is necessary to get the chemical profiling of the aqueous extract of SHD.
The aim of this work was to develop an approach, based on ion mobility enabled high-resolution mass spectrometer coupled with reversed-phase UHPLC, comparison of MSE and HDMSE for the comprehensive profiling and characterization of multicomponent from the classical formula SHD. For this purpose, some efforts had been made: 1) both the chromatography (mobile phase, column temperature and gradient elution program) and MS (in particular the ramp collision energy, capillary voltage and cone voltage) key conditions and parameters were carefully optimized for high separation efficiency, resolution and sensitivity; 2) data-independent MSE and HDMSE acquisition in the positive and negative ESI mode were utilized to obtain the fragmentation information regarding all precursors and their fragments; 3) an in-house database consisting of 642 known compositions and 55 reference compounds were established to assist the structural identification and provide accurate determination of CCS values, rendering the results more reliable; 4) UNIFI™, an intelligent data processing platform that had incorporated the self-built database, can achieve efficiently process and automated peak annotation with reproducible results by establishing streamlined workflows; and 5) explore the differences between the MSE and HDMSE. As a consequence, a number of components are accurately characterized from SHD. In addition, this work emphasizes the advantages of adding one-dimensional separation technology (IM). Hopefully, the combination of Vion™ IMS-QTOF Mass Spectrometer, UNIFI™, and high definition MSE acquisition (HDMSE) offers an efficient comprehensive coverage approach to the characterization of TCM formulae.
2 Materials and methods
2.1 Materials and reagents
In total, 55 compounds, involving seventeen flavonoids (1 violanthin, 2 schaftoside, 3 isoliquiritin apioside, 4 liquiritin, 5 ononin, 6 calycosin-7-O-β-D-glucoside, 7 Methylnissolin-3-O-glucoside, 8 liquiritigenin, 9 isoliquiritigenin, 10 licochalcone B, 11 formononetin, 12 calycosin, 13 procyanidin C1, 14 catechin, 15 L-epicatechin, 16 Schaftoside, 17 7,2′-Hydroxy-3′,4′-dimethoxyisoflavan), eight saponins (18 glycyrrhizic acid, 19 astragaloside IV, 20 astragaloside III, 21 isoastragaloside II, 22 astragaloside I, 23 isoastragaloside I, 24 jujuboside B, 25 glycyrrhetinic acid), there iridoids (26 rehmannioside D, 27 catalpol, 28 melittoside), five monoterpenoids (29 oxypaeoniflorin, 30 galloylpaeoniflorin, 31 albiflorin, 32 benzoyl paeoniflorin, 33 peaoniflorin), one alkaloid (34 ortho-nornuciferine), three phenylethanols (35 verbascoside, 36 isoverbascoside, 37 salidroside), one coumarin (38 8-methoxypsoralen), there phenols (39 6-Gingerol, 40 8-Gingerol, 41 10-Gingerol), six phenolic acids (42 3,5-Dicaffeoylquinic acid, 43 1,3-Dicaffeoylquinic acid, 44 chlorogenic acid, 45 caffeic acid, 46 ferulic acid, 47 gallic acid), five lactones (48 Z-ligustilide, 49 senkyunolide A, 50 senkyunolide H, 51 3-butylphthalide, 52 levistolide A), one amino acid (53 tryptophan), one nucleoside (54 cyclic AMP), and others (55 pentagalloyl glucose), purchased from Shanghai Standard Biotech. Co., Ltd. (Shanghai, China), were used as the reference compounds in this work. Acetonitrile and methanol (Fisher, Fair lawn, NJ, USA) and formic acid (Sigma-Aldrich, MO, Switzerland) were LC-MS grade. Ultra-pure water was in-house prepared by a Milli-Q water purification system (Millipore, Bedford, MA, USA). Leucine-enkephalin was obtained from Sigma-Aldrich (St. Louis, MO, USA). The nine herbs were purchased from Anhui Yuankang Chinese Medicine Decoction Pieces Co. Ltd. (Anhui, China) and Tianjin Tongrentang Chinese Medicine (Tianjin, China), and the authentication was performed by Professor Lijuan Zhang (School of Chinese Materia Medica, Tianjin University of Traditional Chinese Medicine, Tianjin, China).
2.2 Sample preparation
According to the prescription of SHD, pulverized PRA (5.6 g), ASR (2.3 g), AR (2.3 g), C (2.3 g), RR (2.3 g), GRR (1.7 g), CR (1.7 g), JF (7.5 g) and ZRR (13.5 g) were mixed well and immersed in water for 30 min before being decocted twice with 900 ml water, 60 min for each time, after whose filtration was performed with a gauze. The twice extracts were combined and concentrated to about 500 ml. Then, the decoction was obtained. Add 0.6 ml methanol to 0.4 ml the obtained liquid to remove insolubles by alcohol precipitation process. After sample was centrifuged at a rotation speed of 14,000 rpm for 10 min. The supernatant was used as the test solution for SHD.
Reference compounds were dissolved in 70% or pure methanol (approximately 1 mg/mL for each stock solution), and their solutions were prepared as mixed reference compounds solutions for UHPLC/IM-QTOF-MS analysis.
2.3 Chromatographic separation and MS conditions
The high-accuracy MS data for the multicomponent profiling and characterization of SHD were acquired by use of an ACQUITY I-Class UPLC/-Vion IMS-QTOF system (Waters Corporation, Milford, MA, USA). A Waters Acquity UPLC HSS T3 (2.1 × 100 mm, 1.8 µm) maintained at 35 °C was used for chromatographic separation. A binary mobile phase, composed by CH3CN (organic phase: B) and 0.1% FA in H2O (water phase: A), was employed at a flow rate of 0.3 ml/min following an optimal gradient program:0–1 min, 0–6% (B); 1–2 min, 6–7% (B); 2–5 min, 7–8% (B); 5–10 min, 8–12% (B); 10–26 min, 12–26% (B); 26–36 min, 26–40% (B); 36–40 min, 40–41% (B); 40–40.5 min, 41–45% (B); 40.5–50 min, 45–66% (B); 50–53 min, 66–70% (B); 53–56 min, 70–85% (B); 56–59 min, 85% (B). An aliquot of 1.5 µL of the test solution was injected for UHPLC separation.
High-accuracy MSE and HDMSE mode data both in the positive and negative ESI were acquired on Vion IMS-QTOF system. Positive of the Lockspray ion source key parameters used were as follows: capillary voltage, 1 kV; cone voltage, 30 V. In addition, capillary voltage (2 kV) and cone voltage (20 V) were used in negative ESI. Other parameters, same in positive and negative mode, were equipped using the following: source offset, 80 V; source temperature, 120 °C; desolvation temperature, 500 °C; desolvation gas flow, 800 L/h; and cone gas flow, 50 L/h. IM parameter settings are defaulted. The low collision energy was set at 6 eV and the high energy was 15–35 eV. The scan range of full MS was m/z 50–1400 at 0.3 s per scan. Data acquisition and processing were greatly performed by the UNIFI™ software. Calibration of MS data was completed by constantly infusing the leucine enkephalin at a flow rate of 10 µL/min. CCS calibration using a mixture of calibrants was conducted (Paglia et al., 2015).
2.4 Data processing
First, by searching a large number of literature, browsing the Chemspider and Chemical Book websites providing compound structure, and using Chemdraw Professional software used to draw structure, we summarized the known components information of SHD, including Chinese and English names, molecular formulas and structures, which was used to establishment of an in-house known compounds database incorporated in UNIFI™ software. Secondly, we created two different screening analysis methods for MSE and HDMSE data, whose key parameters were set carefully as follows. High-energy intensity threshold, 100.0 counts; low-energy intensity threshold, 20.0 counts. Target by mass: target match tolerance, 5.0 ppm; fragment match tolerance, 10.0 ppm; screen on all isotopes in a candidate, generate predicted fragments from structure, and look for in-source fragments were enabled. Adducts: positive adducts including +H, +Na, +K; negative adducts including −H, +HCOO−. Lock Mass: reference mass, 554.2620 (ESI−), 556.2766 (ESI+). Notably, the difference between the parameter settings of MSE and HDMSE is that the latter is 4D Peaks, adding a dimension-enhanced approach, thus, the parameters of the IM need to be set individually. In target by mass, extract drift specific mass chromatograms for identifying expected fragment ions was checked. Uncorrected data in continuum format were conducted by using screening analysis method of the UNIFI™ (Zuo et al., 2019). Three, an in-house library was imported into the UNIFI™ platform, which performed data correction, peak picking, and peak annotation.
3 Results and discussion
3.1 Optimization of chromatographic and mass spectrometer conditions
To separate so many constituents in SHD with satisfying resolution, analytical columns, mobile phases and column temperature were firstly investigated. We evaluated the effects of Waters Acquity UPLC HSS T3 and BEH C18 columns on the separation of SHD components by comparing the overall resolution and the number of the resolvable peaks (Fig. S1). Comparatively, HSS T3 could show certain retention of the polar components (Rt < 3 min). And it could endure 100% aqueous mobile phase with high column efficiency. Therefore, the HSS T3 column was selected in this experiment. In addition, we compared the influence of the mobile phase system composed of three different concentrations of formic acid (FA) aqueous solution and acetonitrile (CH3CN/H2O, CH3CN/0.05 %FA-H2O and CH3CN/0.1 %FA-H2O) on the number and symmetry of peaks. We found that when the concentration of FA in the aqueous phase was 0.1%, the number of extracted ion chromatographic peaks was the largest and the resolution was higher. Next, the effects of the column temperature (varying between 25 °C and 40 °C) were evaluated. When the column temperature was set at 25 °C and 30 °C, the chromatographic peak shape was poor and the baseline was unstable. When the temperature was 40 °C, the peak resolution during the period of 30–45 min was not better than the peak resolution at 35 °C. It was evident that increasing of the temperature could enhance the elution ability, under which the retention of some components was weakened. We thereby set the column temperature at 35 °C. Accordingly, we selected CH3CN/0.1% FA-H2O at 35 °C as the mobile phase in the following experiments.
Key parameters of the Vion IM-QTOF instrument, which may influence the ion response and the fragmentation, were further optimized in both the negative and positive ESI modes. Take MSE data as an example, optimizing ion-source parameters and collision energy. In the first step, two ion-source parameters, capillary voltage (1.0–3.5 kV) and cone voltage (20–60 V), were optimized using single-factor experiments. By considering the component diversity of SHD, 5 reference compounds, involving chlorogenic acid, benzoyl paeoniflorin, liquiritigenin, calycosin and astragaloside IV, were optimized both in the positive and negative modes. Besides, 6-Gingerol, Z-ligustilide and ortho-nornuciferine also were added in the positive mode, liquiritin apioside, rehmannioside D in the negative mode. Histograms showing the variation tendencies of the ion response for these ten components among different levels of capillary voltage and cone voltage settings both in the positive and negative modes are shown in Fig. 1. In the positive mode, eight index compounds were obviously best ionized at a capillary voltage of 1.0 kV. The cone voltage, ranging from 20 to 60 V, three index compounds exerted little influence on the negative ionization, the others showed high ion response at 20 V, 30 V, 40 V. In general, based on the principle of the highest ionization and the smallest error, conformably, we selected cone voltage of 30 V for analyzing the multicomponent of SHD. On the other hand, the conclusion could be drawn intuitively from the figure, the capillary voltage in the negative mode set at 2.0 kV. The ion response of five index compounds negatively correlated to the cone voltage values, ionization of the others (liquiritin apioside and rehmannioside D) exerted little influence on the negative ionization. Therefore, cone voltage at 20 V was selected in the negative ion mode. In the second step, collision energy is an important parameter that largely affects the quality of the MS2 spectra and the number of components that can be characterized (Wang et al., 2019). Ramp collision energy (RCE) could set different collision energies to cover the collision energy required by most different types of compounds and provide more useful structural information for qualitative identification of SHD. The MS2 spectra obtained at four different levels of RCE in the positive and negative ESI mode were compared (15–35 eV; 25–45 eV; 35–55 eV; 45–65 eV). All types of compounds could produce characteristic fragments at different energies and the abundance of the precursor ions decreased with the increases in the collision energy. And the higher collision energy could enable more thorough fragmentations. The setting of 35–55 eV and 45–65 eV could obtain low-mass product ions, but simultaneously decreased the abundance of the precursor ions of chlorogenic acid, liquiritigenin, calycosin, 6-Gingerol and Z-ligustilide. 15–35 eV energy compared to 25–45 eV, the former could also obtain balanced and diverse fragments at relatively low energy. Therefore, to simultaneously retain the precursor ions and obtain balanced and diverse fragments, we considered the choice of RCE 15–35 eV to be suitable for most index compounds in this study.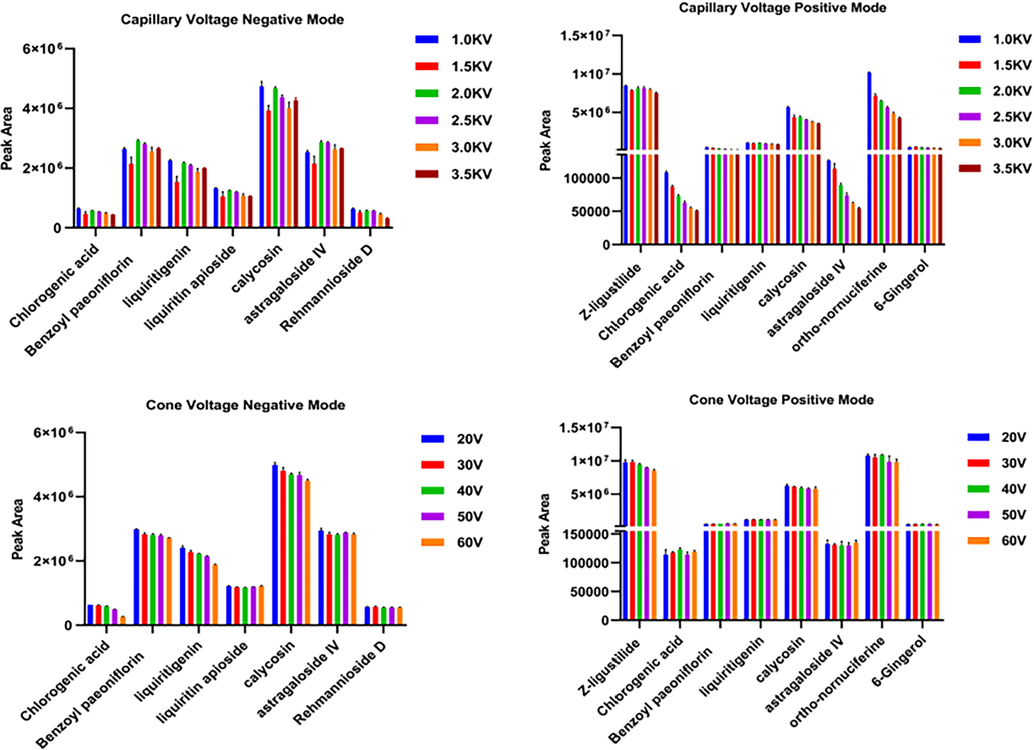
Optimization of two key ion source parameters (capillary voltage and cone voltage) in both the negative and positive ESI modes.
3.2 Identification of chemical constituents from SHD
The characterization of chemical constituents from SHD was performed by UHPLC/IM-QTOF-MS in both the MSE and HDMSE acquisition modes. The total ion chromatogram (TIC) of the SHD extract sample in positive and negative ion modes were shown in Fig. 2. A self-built library including the information of compound Chinese and English name, chemical structure, molecular formula, a total of 642 compounds, was established based on ten herbs components. Multiple approaches, involving precursor accurate mass, accurate mass diagnostic product ions, retention time and drift time with associated CCS acquired from a powerful analysis platform, fragmentation pathways interpretation from literature and a self-built library, were utilized to characterize components detected from SHD. Finally, we could separate and detect 236 compounds. The protonated molecular weights of all target compounds were calculated within an error of 5 ppm. The detailed results were shown in Table S1. The MS2 spectra of representative components of triterpene saponins, flavonoids, monoterpene glycosides, phthalates and phenylethanols identified from SHD are annotated in detail (Fig. 3). The characteristics of precursor ion peak and neutral loss of different types of compounds are summarized.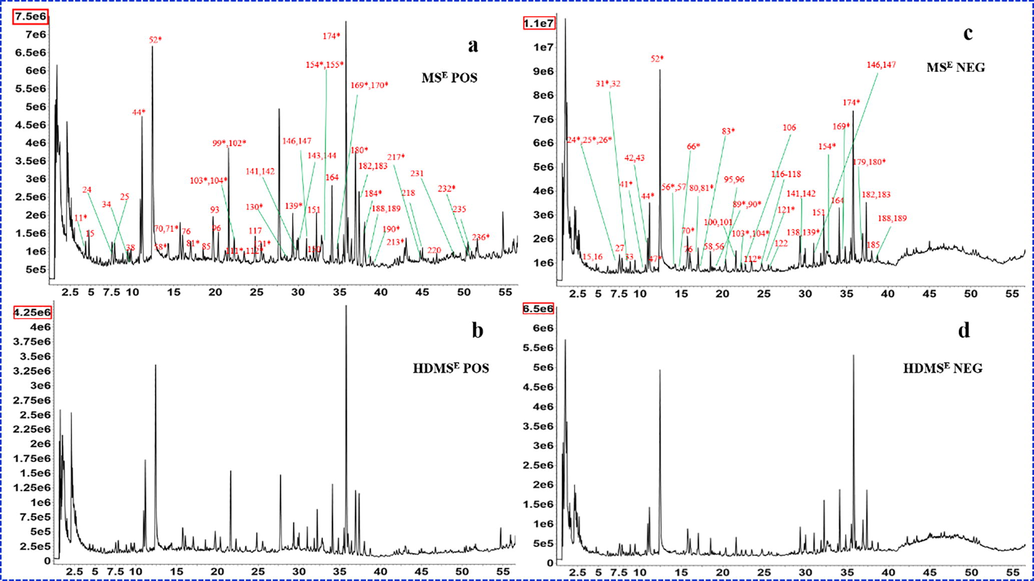
The total ion current (TIC) chromatograms. (a. MSE acquisition in positive mode; b. HDMSE acquisition in positive mode; c. MSE acquisition in negative mode; d. HDMSE acquisition in negative mode.)
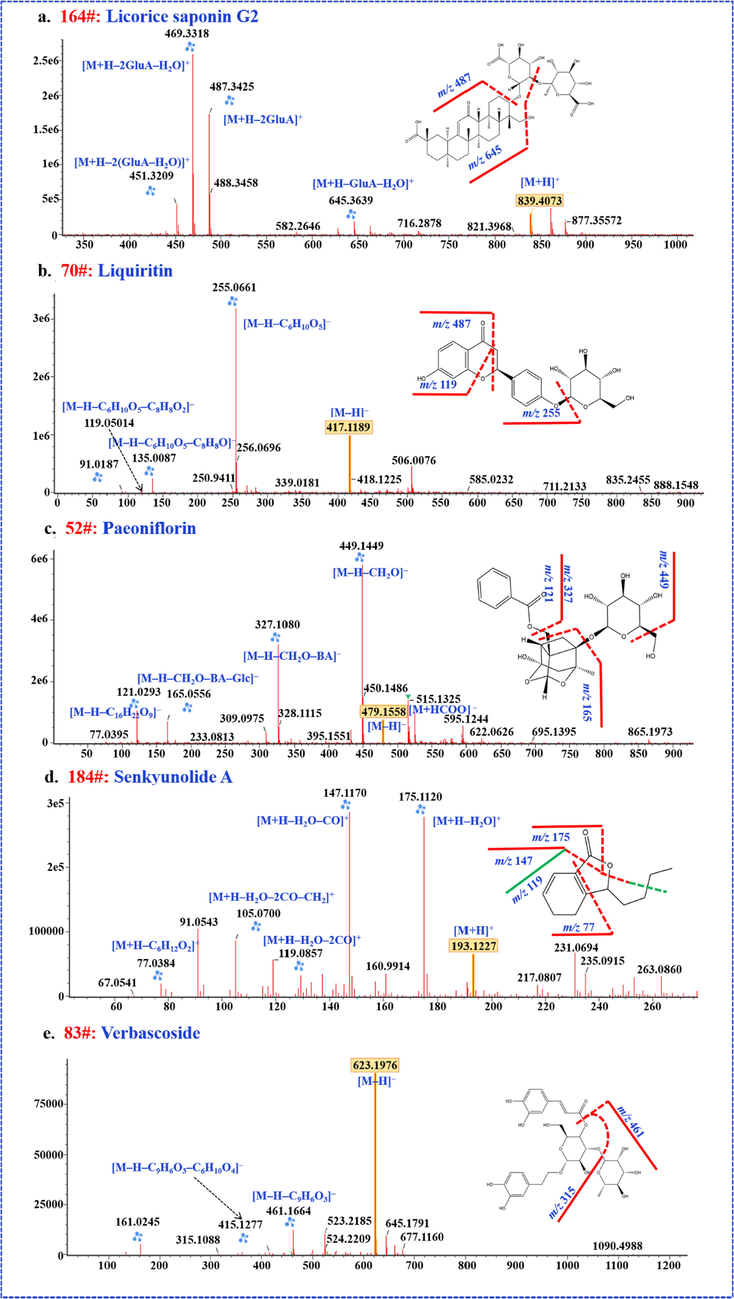
The characteristic MS2 spectra and structures of licorice saponin G2, liquiritin, peaoniflorin, verbascoside and senkyunolide A.
3.3 Triterpene saponins
The triterpene saponins in SHD were acidic saponins from GRR and neutral saponins from AR and ZRR. A total of fifty-seven compounds were identified, of which glycyrrhizic acid, astragaloside IV, astragaloside III, isoastragaloside II, astragaloside I, isoastragaloside I, jujuboside B were identified, by comparing the reference compounds. In positive ESI mode, all compounds could be readily producted precursors [M+H]+and Na-adducts [M+Na]+. Neutral saponins were observed by [M−H]– and [M+HCOO]–, but only [M−H]– for acidic saponins was detected in the negative modes. In general, the cleavage of saponins is mainly the glycosidic linkages, which lose glycosyl continuously or simultaneously, resulting in corresponding characteristic aglycon fragments. Take licorice saponin as an example to illustrate the fragmentation pathways of saponins. The base peaks m/z 351[GlcA–GlcA–H]–and m/z 497[GlcA–GlcA–Rha–H]– are common neutral losses of glycyrrhizin in the negative mode. In addition, acetoxyl group at C22 position and hydroxyl group at C24 position commonly loss in licorice saponins. According to the different base peaks and characteristic fragments of aglycon in MS2 spectra, we could identify them.
3.4 Flavonoids
Flavones and their glycosides are a class of widely distributed bioactive components for plants. The main cleavage pathway of flavonoids is the RDA reaction, which produces two characteristic fragments according to the different core structures. In addition, rings A and B are often substituted by hydroxyl, methyl, methoxy, prenyl, etc. Therefore, under high energy, flavonoids will gradually lose CO (28 Da) and side chain groups to form corresponding fragment ions. Flavonoid glycosides generally eliminate the glycosyl group from the precursor ions, resulting in a characteristic aglycon ion. Its fragmentation pathways is consistent with the precursor ion of the corresponding aglycon. Taking liquiritin as an example to illustrate the cleavage process, the deprotonated precursor ion ([M−H]–) at m/z 417.1191 and characteristic fragment m/z 255.0682 [M−H−C6H10O5]– is given in the negative ion mode. Then the B ring broke and lose CO (28 Da), resulting in fragments m/z 135.0100[M–H–C6H10O5–C8H8O]–. Other compounds could be identified through this fragmentation pathways.
3.5 Monoterpenoids
Monoterpenes and their glycosides were the characteristic bioactive ingredients for PRA. A total of 30 compounds were detected in SHD, and five of them were identified by the reference compounds. It was found that monoterpenes can generate abundant precursor ions ([M+H]+, [M−H]– and [M−HCOO]–) in positive and negative ion mode. Monoterpene glycosides produced shared diagnostic ions fragments in ESI+ and ESI–, such as benzoic acid (122 Da), gallic acid (170 Da), Glc (162 Da), and the small molecules like H2O, and CO. But, neutral loss of CH2O (30 Da) was only observed in the negative mode. After the regular neutral loss, an ion at m/z 165 was produced, the skeleton fragment of the pinanyl group, which was the characteristic fragment ion of paeoniflorin and its derivatives. The CID-MS2 features of paeoniflorin were illustrated in Fig. 3. Information of the other 29 monoterpene compounds that have been identified from SHD is given in Table S1.
3.6 Phthalides
Sixteen phthalides the major constituents from ASR and CR, were tentatively identified in SHD. The five components of Z-ligustilide, Senkyunolide A, Senkyunolide H, 3-Butylphthalide and Levistolide A are identified by the retention time and fragment information of the reference compound. We found that all of them were detected by [M+H]+ and [M+Na]+ in positive mode, but not detected in the negative mode. The 12 components were monomer hydroxyl phthalides, which mainly produced characteristic ions corresponding to the neutral losses of H2O and/or CO. For 4 phthalide dimers (m/z 381), they were split into monomer, and then completes successive or simultaneous losses of H2O and CO in an optimized ramp collision energy.
3.7 Phenylethanols
A total of eight phenylethanol compounds were identified in SHD derived from RR. The phenethylalchohol glycosides are composed of three parts of caffeoyl, phenylethanol and glycosyl (Glc/Rha). The characteristic peak m/z[M–H–162]– was detected in the mass spectrum, which is derived from the removal of glycosyl or caffeoyl from the precursor ion. Peak 83 had a deprotonated precursor ion ([M−H]–) at m/z 623.1940. In MS2 spectrum, predominant product ion at m/z 461.1638, m/z 315.1080 and m/z 135.0441 be detected, showing that the precursor ion successively lost one caffeoyl group, one rhamnosyl group and one glucose. It were identified as verbascoside by comparison with the reference compound. According to the proved fragmentation pathway and the matching results in UNIFI™, the other seven compounds were tentatively identified as forsythiaside E, purpureaside C, jionoside A1, jionoside B1, leucoscceptoside A, martynoside and isomartynoside.
In addition, phenolic acids, phenylpropanoids, tannins, alkaloids, amino acids, nucleosides, coumarins, carbohydrates, gingerols and other types were tentatively identified on the basis of reference compounds and database in this work.
3.8 Comparison of the performance of HDMSE and MSE in profiling of SHD
In this work, we compared the performance of HDMSE and MSE in characterizing SHD and elaborated their differences and complementarity. First, the difference between the total ion chromatogram (TIC) of two acquisition modes were significant, that was, the total ion intensity obtained by HDMSE was low compared to the MSE. Fig. 2 shows the difference response between MSE and HDMSE (7.5e6 VS 4.24e6, in the positive ion mode; 1.7e7 VS 6.5e6, in the negative ion mode), which might be attributed to collisions between the ions and drift gas in ion drift tube. Second, due to an extra, orthogonal dimension of separation provided, HDMSE had a relatively low response. Under the same intensity threshold setting, MSE could screen more results than HDMSE. But importantly, we found that HDMSE could reduce false positives in screening analysis, compared with MSE, and made the matching of precursor ions and fragment ions more accurate. Furthermore, we also found that the mass spectrum of HDMSE mode was cleaner than MSE and the detected precursor ions tended to be single. Therefore, HDMSE made the co-elution further separated, reducing the fragment interference among co-eluting compounds and facilitating accurate analysis of components, which was highlight on this work. For example, Fig. 4a, b shows different performance of HDMSE and MSE on mass spectrum when Calycosin-7-O-β-D-glucoside and liquiritin co-elute at chromatography retention time 15.77 min. In the MSE mode, together with the in-source dissociation, the fragments of the two components interfered a lot, while the HDMSE made the precursor and fragment ions relatively cleaner. In IM experiments, ions are separated based on their CCS as they move through an inert gas environment, the separation recorded as an ion drift time (ms). According to the different CCS value, the m/z 441 and m/z 447 were separated at drift times of 6.7 min and 7.4 min on the mobility trace (Fig. 4c), obviously, which achieved the separation of co-elution. Last not but least, an interesting in-source fragmentation (ISF) was found in HDMSE. Ononin peaked at the retention time of 22.32, and it was prone to in-source cleavage (glycosidic bond breakage) in the positive ion mode. What was exciting was that two m/z 269.08 fragments with different drift times (5.21 min and 7.1 min) were produced at the retention time of 22.31(Fig. 5e). They had the same diagnostic product ions (m/z 253.05, m/z 254.06, m/z 237.05, m/z 213.09), but with different the spectrum response (1e5 VS 8e5) (Fig. 5c and d). In addition, there were also differences in ion fragment kurtosis. By comparing with the reference, it was found that the drift time, secondary fragment type and kurtosis of the former were consistent with formononetin. Therefore, the former was considered to be formononetin produced by cleavage of ononin in the source, and the other might be an m/z 269.08 isomer under in-source fragmentation. The reference ononin also confirmed that it produced two m/z 269.08 fragments under in-source cleavage (Fig. 5f). ISF occurs usually within the intermediate pressure region of the mass spectrometer, between the ESI source, which is at atmospheric pressure, and the analyzer, which is under vacuum (Gathungu et al., 2018). The ion-mobility cell is installed ahead of quadrupole (Q) (Zuo et al., 2020), and thus the in-source fragmentation ion can be separated by IM based on the shape, charge, and size, prior to entering quadrupole.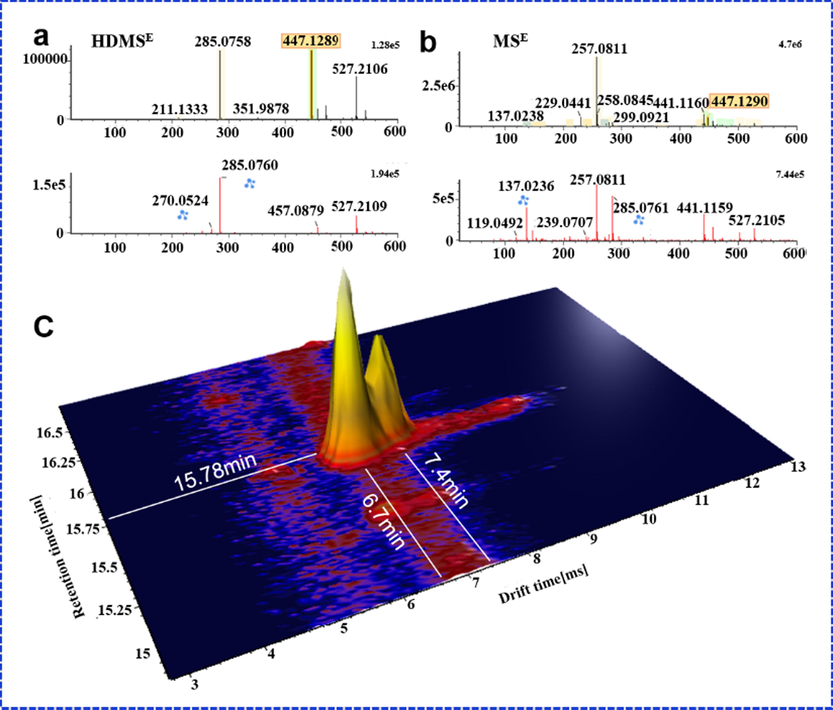
Comparison of the performance between MSE and HDMSE for the co-elution analysis. (a. MS1 and MS2 spectra of calycosin-7-O-β-D-glucoside in HDMSE; b. the MS1 and MS2 spectra of calycosin-7-O-β-D-glucoside in MSE; c. a 3D graph with retention time and drift time in HDMSE.)
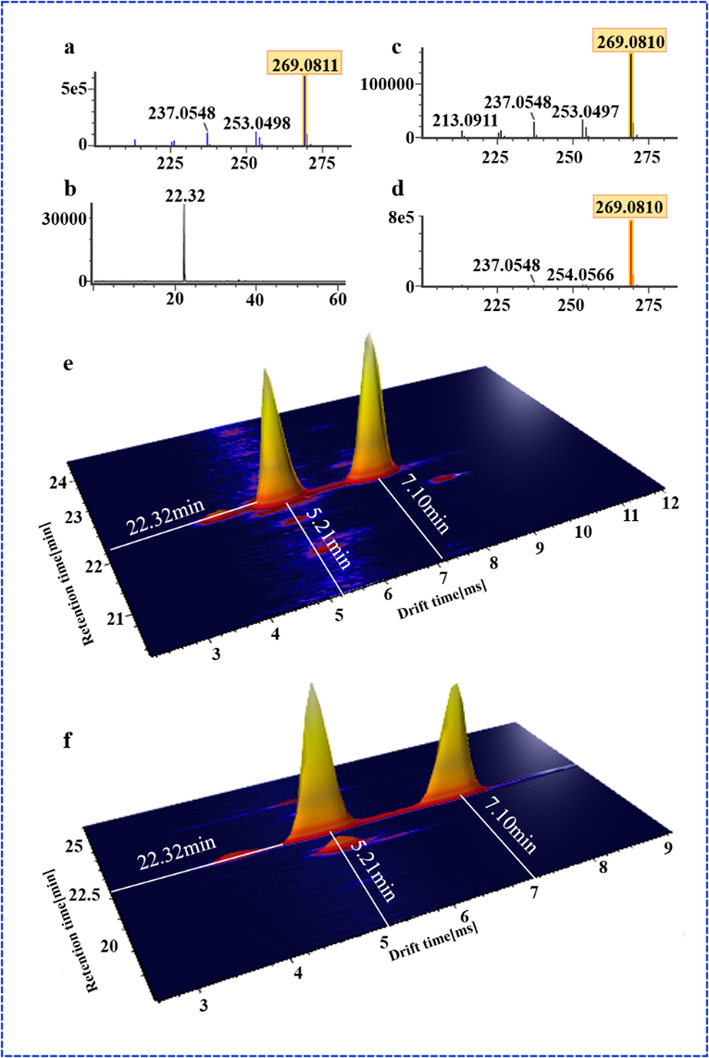
The secondary ion fragments of the reference formononetin and the chromatographic retention time of ononin (a and b), the secondary ion fragments of two isomers (m/z 269) under in-source fragmentation (c and d), 3D graph of two isomers in HDMSE (e), and 3D graph of the reference ononin (f).
Unexpectedly, compounds with similar CCS values will co-elute under a drift time. For example, the compounds with m/z 579.1497 had peaks at RT of 6.12, 6.84, 8.05 and 9.43, and had m/z 427.10, m/z 409.09, m/z 287.05, m/z 271.06, m/z 247.06 same characteristic fragments. The measured CCS values were 226.64, 225.77, 228.83, 231.20, respectively. Through UINIF™ screening analysis, the five components may be Procyanidin B1/B2/B4/B5/B7. However, a potent issue that prevents further accurate identification lies in the absence of the theoretical CCS value library of natural compounds and unprovided prediction theoretical CCS on UNIFI™ platform. Although some components will co-elute under the same retention time or the same drift time, because of the addition of IM separation, the HDMSE data acquisition mode can simultaneously provide four-dimensional data information (retention time, drift time, precursor ion mass and diagnostic product ions), which makes co-eluting ions get further separation. Further, the components co-eluting at the same drift time may have different chromatographic retention characteristics (polarity difference), and vice versa.
At present, ion mobility-mass spectrometry (IM-MS) has showed great application potential for multicomponent characterization of TCMs. Experiments prove that IM combined with DIA, HDMSE, has outstanding advantages. But, there’s still some insufficiency for the established UHPLC/IM-QTOF-HDMSE approach to identify chemicals in TCMs. As far as we know, there are some unknown components that have not yet been identified in the complex TCM systems, and the CCS values currently provided are not completely used to confirm the structure identification results. Therefore, it is necessary to establish a large-scale CCS natural products database. It is hoped that multi-dimensional information can be integrated to significantly improve the coverage and confidence of identification, which could support in-depth multicomponent characterization of TCMs.
4 Conclusion
Aimed to comprehensively elucidate the chemical compositions of TCM, a dimension-enhanced strategy was established, as a solution to the insufficiencies encountered by conventional LC/MS approaches. By applying to the classical formula of SHD as an example, we were able to identify or tentatively characterize a total of 236 compounds based on the CID-MS2 data obtained by MSE and HDMSE in both two ESI modes. We could demonstrate the complementarity of ESI+ and ESI− monitoring and the remarkable advantages of HDMSE over MSE. It was worth noting that the additional IM separation greatly benefitted the resolution of co-eluting components. The presented strategy renders a powerful approach for the comprehensive and efficient multicomponent characterization of complex systems like the TCM formulae, as 4D information (Rt, MS1, MS2, and CCS) can be acquired by once injection analysis. The potential role of CCS in discriminating isomers will be the focus in the continuous research.
Acknowledgments
This research was funded by National Natural Science Foundation of China (Grant No. 82074276), and Projects of International Cooperation of Traditional Chinese Medicine (Grant No. 0610-2040NF020928). In addition, the authors would like to thank the support from the Innovation Group of Component-based Chinese Medicine and Intelligent Manufacturing with multi-crossed disciplines.
Declaration of Competing Interest
The authors declare that they have no known competing financial interests or personal relationships that could have appeared to influence the work reported in this paper.
References
- Development of a combined strategy for accurate lipid structural identification and quantification in ion-mobility mass spectrometry based untargeted lipidomics. Anal. Chim. Acta.. 2020;1136:115-124.
- [CrossRef] [Google Scholar]
- Identification and analysis of components in Shen-Fu-Shu granule extract and in rat plasma after oral administration by UPLC-ESI/Q-TOF-MS. J. Pharm. Biomed. Anal.. 2019;169:159-169.
- [CrossRef] [Google Scholar]
- Ultra high performance liquid chromatography coupled with electrospray ionization/quadrupole time-of-flight mass spectrometry for the rapid analysis of constituents in the traditional Chinese medicine formula Wu Ji Bai Feng Pill. J. Sep. Sci.. 2017;40(20):3977-3986.
- [CrossRef] [Google Scholar]
- Developments in tandem ion mobility mass spectrometry. Biochem. Soc. Trans.. 2020;48(6):2457-2466.
- [CrossRef] [Google Scholar]
- Comparison of the most recent chromatographic approaches applied for fast and high resolution separations: theory and practice. J. Chromatogr. A.. 2015;1408:1-14.
- [CrossRef] [Google Scholar]
- Chemical profiling of Banxia-Baizhu-Tianma decoction by ultra-fast liquid chromatography with tandem mass spectrometry. J. Pharm. Biomed. Anal.. 2019;174:595-607.
- [CrossRef] [Google Scholar]
- Fundamentals of ion mobility spectrometry. Curr. Opin. Chem. Biol.. 2018;42:51-59.
- [CrossRef] [Google Scholar]
- Elucidation of metabolite isomers of Leonurus japonicus and Leonurus cardiaca using discriminating metabolite isomerism strategy based on ultra-high performance liquid chromatography tandem quadrupole time-of-flight mass spectrometry. J. Chromatogr. A.. 2019;1598:141-153.
- [CrossRef] [Google Scholar]
- Optimization of electrospray ionization source parameters for lipidomics to reduce misannotation of in-source fragments as precursor ions. Anal. Chem.. 2018;90(22):13523-13532.
- [CrossRef] [Google Scholar]
- In-source fragmentation and correlation analysis as tools for metabolite identification exemplified with CE-TOF untargeted metabolomics. Electrophoresis.. 2015;36(18):2188-2195.
- [CrossRef] [Google Scholar]
- Systematic profiling of the multicomponent and authentication of Erzhi Pill by UHPLC/Q-Orbitrap-MS oriented rapid polarity-switching data-dependent acquisition and selective monitoring of the chemical markers deduced from fingerprint analysis. Molecules.. 2018;23(12):3143.
- [CrossRef] [Google Scholar]
- Detection and structural characterization of ether glycerophosphoethanolamine from cortical lysosomes following traumatic brain injury using UPLC-HDMSE. Proteomics.. 2019;19(18):1800297.
- [CrossRef] [Google Scholar]
- Simultaneous profiling and holistic comparison of the metabolomes among the flower buds of Panax ginseng, Panax quinquefolius, and Panax notoginseng by UHPLC/IM-QTOF-HDMSE-based metabolomics analysis. Molecules.. 2019;24(11):2188.
- [CrossRef] [Google Scholar]
- A new analytical workflow using HPLC with drift-tube ion-mobility quadrupole time-of-flight/mass spectrometry for the detection of drug-related metabolites in plants. Anal. Bioanal. Chem.. 2020;412(8):1817-1824.
- [CrossRef] [Google Scholar]
- Ion mobility-derived collision cross section as an additional measure for lipid fingerprinting and identification. Anal. Chem.. 2015;87(2):1137-1144.
- [CrossRef] [Google Scholar]
- Infrared laser ablation sampling coupled with data independent high resolution UPLC-IM-MS/MS for tissue analysis. Anal. Chim. Acta.. 2018;1034:102-109.
- [CrossRef] [Google Scholar]
- Collision-energy resolved ion mobility characterization of isomeric mixtures. Analyst.. 2015;140(20):6886-6896.
- [CrossRef] [Google Scholar]
- A four-dimensional separation approach by offline 2D-LC/IM-TOF-MS in combination with database-driven computational peak annotation facilitating the in-depth characterization of the multicomponents from Atractylodis Macrocephalae Rhizoma (Atractylodes macrocephala) Arab. J. Chem.. 2021;14(2):102957.
- [CrossRef] [Google Scholar]
- Novel software-based method to classify structurally similar compounds combined with high performance liquid chromatography-quadrupole time of flight mass spectrometry to identify complex components of herbal medicines. J. Chromatogr. A.. 2012;1264:13-21.
- [CrossRef] [Google Scholar]
- Identification of multiple ingredients for a Traditional Chinese Medicine preparation (bu-yang-huan-wu-tang) by liquid chromatography coupled with tandem mass spectrometry. Molecules.. 2013;18(9):11281-11298.
- [CrossRef] [Google Scholar]
- Systematic quality evaluation of Peiyuan Tongnao capsule by offline two-dimensional liquid chromatography/quadrupole-Orbitrap mass spectrometry and adjusted parallel reaction monitoring of quality markers. Anal. Bioanal. Chem.. 2019;411(29):7747-7760.
- [CrossRef] [Google Scholar]
- In-depth profiling, characterization, and comparison of the ginsenosides among three different parts (the root, stem leaf, and flower bud) of Panax quinquefolius L. by ultra-high performance liquid chromatography/quadrupole-Orbitrap mass spectrometry. Anal. Bioanal. Chem.. 2019;411(29):7817-7829.
- [CrossRef] [Google Scholar]
- novel ion mobility separation-enabled and precursor ions list-included high-definition data-dependent acquisition (HDDDA) approach: Method development and its application to the comprehensive multicomponent characterization of Fangji Huangqi Decoction. Arab. J. Chem.. 2021;14(4):103087.
- [CrossRef] [Google Scholar]
- Simultaneous quantification of 50 bioactive compounds of the traditional Chinese medicine formula Gegen-Qinlian decoction using ultra-high performance liquid chromatography coupled with tandem mass spectrometry. J. Chromatogr. A.. 2016;1454:15-25.
- [CrossRef] [Google Scholar]
- A method toward constituents with weak response, in mass spectra for comprehensively characterizing constituents in traditional Chinese medicine formula, Kangfuxiaoyanshuan as a case. J. Sep. Sci.. 2019;42(19):3152-3160.
- [CrossRef] [Google Scholar]
- High performance liquid chromatography-electrospray ionization-mass spectrometry with programmed ionization mode switching and time segment scanning approach for quantifying multi-components in traditional complex herbal medicines, Qiong-Yu-Gao as an example. J. Pharm. Biomed. Anal.. 2015;112:139-146.
- [CrossRef] [Google Scholar]
- Avoiding misannotation of in-source fragmentation products as cellular metabolites in liquid chromatography-mass spectrometry-based metabolomics. Anal. chem.. 2015;87(4):2273-2281.
- [CrossRef] [Google Scholar]
- Method development and application of offline two-dimensional liquid chromatography/quadrupole time-of-flight mass spectrometry-fast data directed analysis for comprehensive characterization of the saponins from Xueshuantong Injection. J. Pharm. Biomed. Anal.. 2016;128:322-332.
- [CrossRef] [Google Scholar]
- An enhanced targeted identification strategy for the selective identification of flavonoid O-glycosides from Carthamus tinctorius by integrating offline two-dimensional liquid chromatography/linear ion-trap-Orbitrap mass spectrometry, high-resolution diagnostic product ions/neutral loss filtering and liquid chromatography-solid phase extraction-nuclear magnetic resonance. J. Chromatogr. A.. 2017;1491:87-97.
- [CrossRef] [Google Scholar]
- Simultaneous quantitation of five Panax notoginseng saponins by multi heart-cutting two-dimensional liquid chromatography: Method development and application to the quality control of eight Notoginseng containing Chinese patent medicines. J. Chromatogr. A.. 2015;1402:71-81.
- [CrossRef] [Google Scholar]
- Simultaneous qualitative and quantitative evaluation of Ilex kudingcha C. J. tseng by using UPLC and UHPLC-qTOF-MS/MS. J. Pharm. Biomed. Anal.. 2018;155:15-26.
- [CrossRef] [Google Scholar]
- Data-dependent acquisition and database-driven efficient peak annotation for the comprehensive profiling and characterization of the multicomponents from compound xueshuantong capsule by UHPLC/IM-QTOF-MS. Molecules.. 2019;24(19):3431.
- [CrossRef] [Google Scholar]
- Offline two-dimensional liquid chromatography coupled with ion mobility-quadrupole time-of-flight mass spectrometry enabling four-dimensional separation and characterization of the multicomponents from white ginseng and red ginseng. J. Pharm. Anal.. 2020;10(6):597-609.
- [CrossRef] [Google Scholar]
- Integration of data-dependent acquisition (DDA) and Data-independent high-definition MSE (HDMSE) for the comprehensive profiling and characterization of multicomponents from Panax japonicus by UHPLC/IM-QTOF-MS. Molecules.. 2019;24(15):2708.
- [CrossRef] [Google Scholar]
- Highly selective monitoring of in-source fragmentation sapogenin product ions in positive mode enabling group-target ginsenosides profiling and simultaneous identification of seven Panax herbal medicines. J. Chromatogr. A.. 2020;1618:460850.
- [CrossRef] [Google Scholar]
- A multidimensional analytical approach based on time-decoupled online comprehensive two-dimensional liquid chromatography coupled with ion mobility quadrupole time-of-flight mass spectrometry for the analysis of ginsenosides from white and red ginsengs. J. Pharm. Biomed. Anal.. 2019;163:24-33.
- [CrossRef] [Google Scholar]
Appendix A
Supplementary material
Supplementary data to this article can be found online at https://doi.org/10.1016/j.arabjc.2021.103356.
Appendix A
Supplementary material
The following are the Supplementary data to this article:


