

Translate this page into:
Ultrasound-assisted extraction of four groups of Osmanthus fragrans fruit: Optimization, UPLC-Orbitrap-MS/MS characterization and anti-inflammatory activity evaluation
⁎Corresponding author. tweizhuo@126.com (Weizhuo Tang)
-
Received: ,
Accepted: ,
This article was originally published by Elsevier and was migrated to Scientific Scholar after the change of Publisher.
Abstract
In this study, simultaneous optimization of ultrasound-assistant extraction (UAE) of four representative groups of Osmanthus fragrans (OF) fruit was firstly performed using the response surface methodology (RSM). Subsequently, qualitative and quantitative analysis of irioid glycosides from the optimized OF fruit extract was performed using UPLC-ESI-Orbitrap-MS/MS. A total of 13 irioid glycosides were tentatively identified, of which six compounds were identified for the first time. Finally, the anti-inflammatory activity of the optimized OF var. aurantiacus Makino (OFA) fruit extract was evaluated based on a CuSO4-induced zebra fish model. The biological results demonstrated that OFA fruit extract at a concentration of 5 μg/mL could significantly reduce the number of macrophages, but no significant activities were observed at high concentrations (10 and 50 μg/mL). These results suggest that OF fruit has the promise as a functional additive in food for health promotion.
Keywords
Ultrasound-assisted extraction
Osmanthus fragrans fruit
Iridoid glycosides
Anti-inflammatory activity
Zebra fish

1 Introduction
Osmanthus fragrans (OF), renowned for its multi-coloured flower and pleasant fragrance, is universally cultivated in most Asian regions and is especially distributed in southern China. Due to the high amounts of phenolic acids and flavonoids, OF has been recently viewed as a potential source of natural antioxidants for ingredients in functional foods (Jiang et al., 2016). OF fruit, which is composed of purple peel and light yellow seed, is the main by-product of the OF-related industry. Remarkably, OF fruit has been described as effective for the relief of cardiodynia and stomach ache, implying promise as a functional additive in food for health promotion. Moreover, OF fruits have previously been proven to exhibit selected biological activities, including antioxidant (Huang et al., 2011), anti-inflammatory (Li et al., 2013) and platelet aggregation inhibition activities (Tang et al., 2015). Therefore, a comprehensive systematic analysis of OF fruit is necessary and beneficial for its efficient utilization. However, the abundant OF fruit resources are always ignored and have not been fully utilized. Most of the OF fruits are used only as fertilizer or are even considered as agriculture waste. Thus, revisiting and increasing the value of this by-product with respect to its biomedical utility has aroused great interest by both chemists and pharmacologists.
Thus far, several secondary metabolities of OF fruits have been reported, including salidroside, verbenalin and oleoside-11-methyl ester (Ouyang et al., 2015), ursolic acid, sitosterol, and benzoic acid (Qiao et al., 2015), and nicotinamide, oleanolic acid, and betulin (Yin et al., 2013). In particular, among of these metabolities, iridoid glycosides were proposed as the representative chemicals from the genus Osmanthus. Other types of bioactive compounds identified from OF fruit include natural melanin (Pan et al., 2009) and red pigment (Wang et al., 2006). Generally, for the recovery of bioactive constituents from natural materials, conventional techniques including maceration and Soxhlet extraction were extensively applied, but these established methods suffer from several disadvantages, such as relatively low yields and time-consuming procedures. The application of an innovative extraction technology such as ultrasound-assistant extraction (UAE) has been proposed, and the principle of UAE is that acoustic cavitation can improve the extraction yield and reduce the extraction time and solvent consumption (Medina-Torres et al., 2019).
Moreover, response surface methodology (RSM) is an effective and powerful statistical method for optimizing experimental conditions with a reduced number of experimental trials. Recently, RSM has been successfully applied to optimize the extraction processes of a number of bioactive compounds from the food industry, e.g., red pigment from Zanthoxylum bungeanum maxim (Chen et al., 2018), phenolic compounds from plum seeds (Savic & Ivana, 2021) and black locust (Robiniae Pseudoacaciae) flowers (Gajic et al., 2019), polyphenols from Triticum aestivum L. (Savic & Ivana, 2020), edible oils from silkworm pupal (Hu et al., 2017), triterpenoids from Ganoderma lucidum (Oludemi et al., 2018), and total flavonoids from Osmanthus fragrans (Yu et al., 2017). However, little information is available on simultaneous investigation of extraction technology and chemical profiles of the OF fruit.
Finally, from a taxonomy point view, OF species can be mainly divided into the four groups of O. fragrans var. thunbergii Makino (OFM), O. fragrans asiaticus Nakai (OFN), O. fragrans var. aurantiacus Makino (OFA) and O. fragrans var. semperflorens Hort (OFS) based on different flower colours, inflorescence types and florescence (Wu et al., 2004). Although the UAE of natural antioxidants from OF fruit (Cheng, 2011) and flower (Li et al., 2016) have been reported, simultaneously comparative investigation on the difference among these four groups of OF fruits is still limited. Consequently, in this study, optimization of UAE for four representative groups of OF fruits by RSM was firstly addressed. Subsequently, characteristic qualitative and quantitative analyses of the optimized OF fruit extract was performed, and finally the anti-inflammatory effect of OF fruit in a zebra fish model was evaluated.
2 Materials and methods
2.1 Materials and reagents
Four different groups of OF fruits were purchased from the online garden shop in Suqian, China in June 2017 and identified by Prof. Jianrong Chen (Changsha University). Voucher samples (No. GHZ1701, GHZ1702, GHZ1703, and GHZ1704 for OFM, OFN, OFA, and OFS, respectively) were deposited in the small molecular natural products research laboratory at Changsha University. All reagents and chemicals were of analytical grade. Acetonitrile and methanol in high performance liquid chromatography (HPLC) grade were obtained from Sinopharm Chemical Reagent CO., Ltd. (Shanghai, China). Phosphoric acid was acquired from Shanghai Aladdin Reagent CO., Ltd. (Shanghai, China). Ultrapure water was purchased from A.S. Watson Group Ltd. (Hongkong, China). The authentic standards were purchased from Shanghai Yuanye Bio-Tech Co., Ltd. (Shanghai, China).
2.2 Ultrasound-assisted extraction
UAE was conducted in an ultrasonic device (KQ-100DV, Kunshan, China). The OF fruits were dried (60 °C) to constant weight and powdered (40 mesh), and 10.0 g of sample was extracted with ethanol/water (%, v/v) extraction solvents at a suitable liquid-to-solid ratio for different times and different ranges of ethanol content. The mixture solution was treated in the ultrasonic extractor at a power level of 400 W. The obtained extraction solutions were filtered and evaporated under reduced pressure at 40 °C to remove the solvents. The extraction yield was expressed as a percentage (%, w/w) calculated by dividing the weight of the residue by the weight of the dry samples.
2.3 Experimental design of UAE for four representative species of OF fruits
A three-level three-factor Box-Behnken design (BBD) combined with RSM was applied to optimize the UAE of four types of OF fruits. Based on preliminary single-factor experiments (data shown in Table S1-S3), the independent variables were selected as the extraction time (X1: 30.00–70.00 min), ethanol concentration (X2: 35.00–75.00%), and liquid-to-solid ratio (X3, 10.00–20.00 mL/g), and the response variable was the extraction yield of OF fruits. The general second-order polynomial equation was employed to fit the data as described as follow: where, Y is the response variable (dependent variable); β0 corresponds to a constant coefficient; βi, βii, and βij are the regression coefficients of the linear, quadratic and interactive terms, respectively, and Xi and Xj define the independent coded variables, and n represents the number of variables.
2.4 Scanning electron microscopy (SEM) observation
Morphological alteration of samples was observed by a SEM instrument (JEOL JSM-7500F, Tokyo, Japan). Samples were dried and coated with gold, and micrographs were collected at 500x magnification.
2.5 Chemical qualitative analysis of optimized OFA fruit
2.5.1 Sample preparation
An amount of 7.26 mg of OFA fruit power was weighed and mixed with 1 mL of 56% ethanol. The mixture was further processed with UAE for 0.5 h. The sample was filtered through a 0.45 μm polytetrafluoroethylene membrane and held at −18 °C until analysis.
2.5.2 Liquid chromatography (LC) system
Ultra-performance liquid chromatography (UPLC) qualitative analyses were performed using a Thermo Scientific Ultimate 3000 UPLC system (Thermo Fisher Scientific, San Jose, USA) equipped with a quaternary pump, an autosampler, a photo diode array (PDA) detector and a thermostated column compartment. Samples were separated on a Thermo Scientific Hypersil GOLD C18 (150 × 2.1 mm, 1.9 μm) column at room temperature. The mobile phase consisted of water containing 0.1% formic acid (A) and acetonitrile (B), and the elution gradient was set as follows: 95% A (0 min), 85% A (9 min), 55% A (24 min), 10% A (39 min), 5% A (43 min), and 95% A (46 min). The mobile phase flow rate was 0.3 mL/min, and the injection volume was set at 5 μL.
2.5.3 Mass spectrometry
Mass spectrometry was performed on a Thermo-fisher Q Exactive Focus high-resolution benchtop quadrupole Orbitrap mass spectrometer (Thermo Fisher Scientific, San Jose, USA) using a heated electrospray ionization (ESI) source for ionization of the target compounds in positive and negative ion modes. The optimized parameters of mass spectrometry are listed as follows: spray voltage: +4.0 kV; sheath gas flow: 35 arbitrary units; auxiliary gas flow: 5 arbitrary units; heat temperature: 300 °C; capillary temperature: 350 °C; scan range: m/z 100–1500; scan mode: full mass (resolution 70,000) and resolution for higher energy collisional dissociation cell (HCD) spectra was set to 17,500 at m/z 150.
2.6 Quantitative analysis of the optimized OFA fruit
2.6.1 Preparation of sample and standard solutions
An amount of 0.1 g of OFA fruit power was weighed and mixed with 10 mL of 56% ethanol. The mixture was further processed with UAE for 0.5 h. The sample was filtered through a 0.45 μm membrane filter and held at −18 °C until analysis.
For standard solutions preparation, a stock solution of nine reference standards was prepared in the concentrations ranging from 120 to 150 μg/mL in methanol and stored at 4 °C until analysis. The standard working solutions of the mixtures were obtained by diluting stock solutions to target concentrations.
2.6.2 LC system
The sample was examined on a Waters alliance e2695 system equipped with a Waters 2998 detector and an YMC-Pack ODS-A column (10 × 250 mm, 5 μm) at 25 ℃ with a flow rate of 1.0 mL/min. A mobile phase consisting of 0.1% phosphoric acid (A) and acetonitrile (B) was used in multistep gradient mode. The optimized gradient was applied as follows: 0–35 min, 10–30% B; 30–35 min, hold at 30% B; 35–50 min, 30–50% B.
2.7 Anti-inflammatory activity of OFA fruit extract in zebra fish model
2.7.1 Zebra fish maintenance
Transgenic zebra fish (Tg:zlyz-EGFP) expressing enhanced green fluorescent protein (EGFP) in macrophages were purchased and cultivated from the Key Laboratory for Drug Screening Technology of Shandong Academy of Sciences (Jinan, China). The conditions of their maintenance were in accord with guidelines of the Organization for Economic Co-operation and Development (OECD). The fish were maintained under a 14/10 h light/dark cycle at constant temperature (28 ± 0.5 °C) in a closed flow-through system with charcoal-filtered tap water to ensure normal spawning. Zebra fish were fed brine shrimp twice per day. Adult zebra fish laid eggs in a breeding tank. The eggs were washed and moved to tanks filled with embryo medium containing methylene blue. Finally, these embryos were cultured at 28 °C for subsequent experiments.
2.7.2 CuSO4-induced inflammation model
The CuSO4-induced inflammation model was established according to the published literature with selected modification (Li et al., 2018). In brief, healthy zebra fish larvae were selected and divided randomly into 24-well plates (n = 8/well) at 3 days post-fertilization (dpf). Exposure groups were segmented into six groups, namely, a control group (fresh fish water), a model group (3.2 μg/mL CuSO4), a positive control group (3.2 μg/mL CuSO4 + 5 μg/mL Indomethacin) and three drug groups with a low concentration group (3.2 μg/mL CuSO4 + 5 μg/mL OFA fruit extract), medium concentration group (3.2 μg/mL CuSO4 + 10 μg/mL OFA fruit extract), and high concentration group (3.2 μg/mL CuSO4 + 50 μg/mL OFA fruit extract). CuSO4 was added to the drug groups and incubated for 2 h after treatment with different concentrations of OFA fruit extract. Finally, the inflammatory reaction was observed and imaged. All treatments were performed in triplicate, and all well plates were maintained in a 5 mL final volume of embryo medium. Each zebra fish larva was imaged using a SZX16 fluorescence microscope (Olympus, Tokyo, Japan), and the number of macrophages was recorded using Image-Pro Plus software.
2.8 Statistical analysis
All data analyses were performed using Statistical Package for the Social Sciences (SPSS 13.0) and Excel (2010) software. The methods used to calculate statistically significant differences were the two-tailed unpaired t-test analysis of variance analysis (ANOVA). The differences between means were analysed via the t-test at a significance level of p < 0.05.
3 Results and discussion
3.1 Optimization of UAE for four representative groups of OF fruits
The UAE parameters, including extraction time, ethanol concentration, and liquid-to-solid ratio, were optimized by RSM using BBD to obtain the maximum extraction yield of OF fruits. All of the experimental data from the established response surface analysis model are shown in Table 1.
Runs
Ultrasonic time (X1, min)
Ethanol concentration (X2, %)
Liquid-to- solid ratio (X3, mL/g)
Extraction yield (%)
Y1
OFMY2
OFNY3
OFAY4
OFS
1
−1(30)
−1(35)
0(15)
6.48
7.16
6.45
6.01
2
1(70)
−1(35)
0(15)
6.51
7.72
6.27
6.13
3
−1(30)
1(75)
0(15)
6.52
8.53
6.34
6.64
4
1(70)
1(75)
0(15)
6.67
8.18
6.54
6.81
5
−1(30)
0(55)
−1(10)
7.01
7.30
6.59
6.95
6
1(70)
0(55)
−1(10)
7.02
7.25
6.68
7.12
7
−1(30)
0(55)
1(20)
7.12
6.97
6.88
7.44
8
1(70)
0(55)
1(20)
7.19
8.34
6.78
7.77
9
0(50)
−1(35)
−1(10)
7.36
7.48
6.85
7.93
10
0(50)
1(75)
−1(20)
7.45
8.05
6.88
8.06
11
0(50)
−1(35)
1(20)
7.47
7.28
6.90
8.27
12
0(50)
1(75)
1(20)
7.49
8.32
7.18
8.58
13
0(50)
0(55)
0(15)
7.70
8.53
7.20
8.69
14
0(50)
0(55)
0(15)
7.71
8.83
7.67
8.75
15
0(50)
0(55)
0(15)
7.85
8.45
7.94
8.85
16
0(50)
0(55)
0(15)
7.72
8.51
7.63
8.70
17
0(50)
0(55)
0(15)
7.74
8.46
7.39
8.73
3.1.1 Fitting of the model
The results of ANOVA for the quadratic model are shown in Table 2, and the significance of each coefficient was determined by the F-value and p-value. In general, a larger F-value and smaller p-value indicate a more significant effect on the corresponding coefficient. As illustrated in Table 2, almost p-values of four OF fruits were less than 0.05, indicating that the model was significant. Moreover, the lack of fit was used to measure the coincidence of fit between the model and the data when the lack of fit with non-significance (p > 0.01) indicated the model fit the data well. In this model, the F-values of lack of fit for four OF fruits were 0.21, 1.82, 0.074 and 5.74, respectively, indicating that the lack of fit was not significant relative to pure error. In addition, from Table 2, it can also be observed that all factors, excepted for the interaction terms of X1X2, and X2X3 shown significant effects on the extract yields (p < 0.05) among the four groups of OF fruits. The predicted extract yields for four types of OF fruits were expressed from the second-order polynomial equations are shown in Table 3. It should be noticed that the insignificant terms can be excluded from the second-order polynomial model but respecting the hierarchy and thus the X1X2, and X2X3 interactions will excluded from the second-order polynomial model to improve the existing models. Generally, the coefficient of determination (R2) depicted the proportion of the total variation in the response expected by the model, while the adjustment coefficient of determination (Adjusted R2) was used to analyse the model adequacy. From Table 3, the differences between the normal R2 and adjusted R2 of UAE of all types of OF fruits were all less than 0.2, which indicating a reasonable agreement (Savic and Ivana, 2021). Additionally, the normal probability plots for the reduced quadratic models for four types of OF fruits are presented in Fig. S1, from which no significant deviations in the straight lines were observed, implying that the studentized residuals of the models have a normal distribution.
Variables
Sum of squares
Df
Mean square
F-value
p-value
Sum of squares
Df
Mean square
F-value
p-value
OFM fruit
OFN fruit
Model
2.96
9
0.33
89.13
<0.0001
4.92
9
0.55
9.12
0.0127
X1-extraction time
0.008
1
0.0085
2.29
0.0105
0.29
1
0.29
4.88
0.0482
X2-ethanol concentration
0.012
1
0.012
3.26
0.0310
1.48
1
1.48
24.67
0.0042
X3-liquid-to-solid ratio
0.023
1
0.023
6.27
0.0453
0.086
1
0.086
1.44
0.0245
X1 X2
0.0036
1
0.0036
0.98
0.3685
0.21
1
0.21
3.45
0.1223
X1 X3
0.0009
1
0.0009
0.24
0.0423
0.50
1
0.50
8.41
0.0338
X2 X3
0.0012
1
0.0012
0.33
0.5894
0.055
1
0.055
0.92
0.3813
X12
2.26
1
2.26
613.6
<0.0001
0.97
1
0.97
16.12
0.0102
X22
0.67
1
0.67
181.2
<0.0001
0.14
1
0.14
2.32
0.1881
X32
0.048
1
0.048
13.14
0.0151
1.45
1
1.45
24.18
0.0044
Lack of Fit
0.00438
3
0.0015
0.21
0.8845
0.22
3
0.073
1.82
0.3733
OFA fruit
OFS fruit
Model
2.76
9
0.31
5.40
0.0390
12.60
9
1.40
57.20
0.0002
X1-extraction time
0.00001
1
0.00001
0.0002
0.0287
0.079
1
0.079
3.22
0.0326
X2-ethanol concentration
0.028
1
0.028
0.49
0.0164
0.38
1
0.38
15.56
0.0109
X3-liquid-to-solid ratio
0.068
1
0.068
1.21
0.0220
0.50
1
0.50
20.57
0.0062
X1 X2
0.036
1
0.036
0.64
0.4612
0.00063
1
0.00063
0.026
0.3785
X1 X3
0.00902
1
0.00902
0.16
0.0164
0.00703
1
0.00703
0.29
0.0151
X2 X3
0.016
1
0.016
0.28
0.6221
0.00772
1
0.00772
0.32
0.5986
X12
1.87
1
1.87
32.97
0.0022
9.76
1
9.76
398.7
<0.0001
X22
0.89
1
0.89
15.74
0.0107
2.01
1
2.01
82.24
0.0003
X32
0.094
1
0.094
1.65
0.0453
0.13
1
0.13
5.15
0.0025
Lack of Fit
0.00313
3
0.00104
0.074
0.9988
0.11
3
0.037
5.74
0.1520
Types
Second-order polynomial equations
R2 value
R2adjusted value
OFM
Y = 0.49 + 0.19X1 + 0.12X2 − 0.12X3 + 7.5 × 10−5X1X2 + 1.5 × 10−4X1X3 − 1.75 × 10−4X2X3 − 1.95 × 10−3X12 − 1.06 × 10−3X22 + 4.58 × 10−3X32
0.9938
0.9827
OFN
Y = 1.61 + 0.12X1 + 0.08X2 + 0.53X3 − 5.68 × 10−4X1X2 + 3.55 × 10−3X1X3 + 1.17 × 10−3X2X3 − 1.27 × 10−3X12 − 4.85 × 10−4X22 − 0.03 × 10−3X32
0.9426
0.8391
OFA
Y = 1.63 + 0.17X1 + 0.12X2 + 0.19X3 + 2.30 × 10−4X1X2 − 4.70 × 10−4X1X3 + 6.25 × 10−4X2X3 − 1.77 × 10−3X12 − 1.22 × 10−3X22 − 6.36 × 10−3X32
0.9067
0.8388
OFS
Y = 6.15 + 0.40X1 + 0.20X2 − 0.21X3 + 3.14 × 10−5X1X2 + 4.19 × 10−4X1X3 + 4.39 × 10−4X2X3 − 4.06 × 10−3X12 − 1.84 × 10−3X22 + 7.39 × 10−3X32
0.9904
0.9731
Based on the established mathematical model, the optimal conditions for four types of OF fruits were summarized in Table 4. Considering feasibility of operation, these predicted parameters could be modified to experimental conditions, which also as illustrated in Table 4. Under the above conditions, the extraction yields for OFM, OFN, OFA, and OFS were 7.83%, 8.75%, 7.35%, and 9.42%, respectively, which showed a good fit for the predicted values (7.92%, 8.86%, 7.62%, and 9.22%) forecasted from the model. Therefore, the extraction conditions achieved by RSM were reliable and practical.
OFM
OFN
OFA
OFS
Prea
Expb
Pre.
Exp.
Pre.
Exp.
Pre.
Exp.
X1 (min)
50.61
50
50.57
50
49.91
50
50.87
50
X2 (%)
55.55
55
75.00
75
56.56
56
58.55
58
X3 (mL/g)
20.00
20
15.93
16
16.53
17
20.00
20
Yield (%)
7.92
7.83
8.86
8.75
7.62
7.35
9.22
9.42
3.1.2 Analysis of the response surface
As shown in Fig. 1, the 3D response surfaces of UAE for four OF fruit yields were used to analyse the interaction effects of three variables based on the regression equation. The shape of the response surface reflected the range of the variables. When the shape was convex, the range of variables was set reasonably, and when the shape of contour plot was elliptic instead of round, the interaction between variables was significant.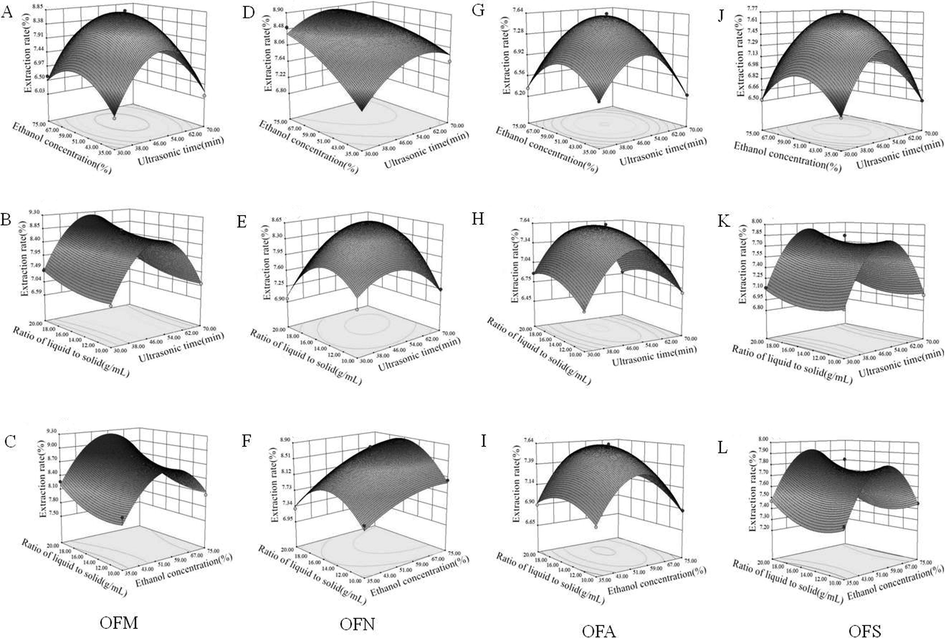
The 3D response surface showing the effects of extraction time, ethanol concentration, and liquid-to-solid ratio, on the extraction efficiency of four representative OF fruits extracts (OFM: A, B, and C; OFN: D, E, and F; OFA: G, H, and I; OFS: J, K, and L).
From Fig. 1, the response trends for four types of OF fruits showed no obvious differences. Fig. 1A, D, G, and J show the mutual effect between ultrasound extraction time and ethanol concentration on the extraction yields at a fixed liquid-to-solid ratio. The extraction yields for OFM, OFN, OFA, and OFS first dramatically increased with an increase in the extraction time in the range of 30–50 min, and subsequently, the growth significant decreased after 50 min, except for OFN, for which the growth declined slowly after 50 min. The growth of extraction yields in line with the increase of extraction time was mainly ascribed to the adequate time for the enhancement of effective extraction of those components (Hu et al., 2017). However, the longer exposure to ultrasonic might be resulted in the degradation of substances and thus an extension of the extraction time should be carefully considered (Ma et al., 2009). The circular contour shape showed that the interaction of the extraction time and ethanol concentration were significant in OFM, OFA, and OFS but insignificant in OFN. The effects of ultrasound extraction time and liquid-to-solid ratio on the extraction yields are shown in Fig. 1B, E, H, and K. An increase of the liquid-to-solid ratio could significantly improve the extract yields, but a further increase of the liquid-to-solid ratio led to a decrease of the extraction yield, as illustrated for OFN and OFA. When the liquid-to-solid ratio was 16.00 mL/g and the extraction time was 50 min, the extract yields reached a maximum. The influence of liquid-to-solid ratio on extraction yields was mainly due to the mutual contact chance between solvent and material. A few solvent volume could reduce this effect and thus led to insufficient extraction, whereas a more solvent volume could obtain effectively extract and result in higher yields (Hu et al., 2017). The circular contour shape showed that the interaction of the extraction time and liquid-to-solid ratio was significant in OFN and OFA but was insignificant in OFM and OFS. As reported in Fig. 1C, F, I and L, the effects of the liquid-to-solid ratio and ethanol concentration on the extraction yields were evaluated. With the growth of the ethanol concentration, the extraction yield increased obviously in the range of 35–55%, and the growth significantly decreased after 55%, except for OFN, for which the growth declined slowly after 55%. The effect of ethanol concentration on extraction yields was that the growth of ethanol concentration might be more favorable for the penetration of the solvent to the cells, which promoting the permeation effects, so as to increase the extraction yields initially (Medina-Torres et al., 2019). When the ethanol concentration reached to a critical point, the extraction yield decreased dramatically. This might be attributed to a higher ethanol concentration could change the solvent polarity and affect the solubility of the components (Hu et al., 2015). Additionally, the circular contour plots showed that the interaction between the liquid-to-solid ratio and ethanol concentration was significant in OFA and OFN but insignificant in OFM and OFS. The difference behaviours among these four types of OF fruits in their extraction process might be related to the different plant matrix.
Based on the above considerations, the extraction yields among the four groups of OF fruits had no significant differences. However, the OFA fruit was targeted for further SEM experiments, qualitative and quantitative analysis, and biological evaluation because of its well-fit response model.
3.2 Effect of UAE on the physical structure in OFA fruit
To better understand the effect of UAE on the physical structures, the OFA fruit powders were examined by SEM to elucidate the morphological changes of the samples. Fig. 2A shows the intact cellular wall before treatment. In this case, the original cell structures of OFA are smooth and intact. As shown in Fig. 2B, after UAE, the morphology of the sample was obviously broken down, and the cell walls of OFA were nearly ruptured. Additionally, we noted that a highly wrinkled surface and perforations of the visible membranes were observed in the tissues. The SEM results indicated that the UAE technique could efficiently enhance the release of chemical constituents from the OF fruits, which in accordance with the result of the UAE of total flavonoids from the OF flowers (Yu et al., 2017).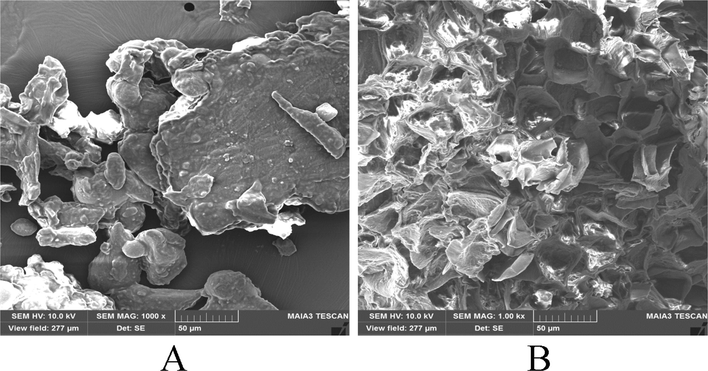
Scanning electron micrographs of OFA fruits: OFA fruit sample for UAE without treatment (A); OFA fruit sample after UAE treatment (B).
3.3 Qualitative characterization of iridoid glucosides in OFA fruit
Iridoid glucosides has been proposed as the main components from the genus Osmanthus, which has been linked to a wide range of activities, including antioxidant (Al-Hamoud et al., 2019), anti-inflammatory (Niwa et al., 2020), alpha-glucosidase inhibitory (Mao et al., 2016) and hepatoprotective effects (Luo et al., 2016). Thus far, systematic characterization of irioid glucosides from OF fruits is limited. Therefore, the bioactive iridoid glucosides in OFA fruit were investigated, and a UPLC-ESI-MS/MS experiment with both positive and negative ion modes (Fig. S2) was conducted to assign the corresponding signals. As illustrated in Fig. 3 and Table 5, 13 iridoid glucosides were tentatively identified. Of these, compounds 4, 5, 8, 9, 10, and 13 were discovered in OF fruits for the first time. Structural assignment of these iridoid glucosides was performed using the results of high-resolution MS and a series of their fragment ions (MS2) as well as comparison of the authentic standards. It was found that these iridoid glucosides derivatives appear as the adduct molecular ions [M+NH4]+ and [M+H] + in positive ion mode.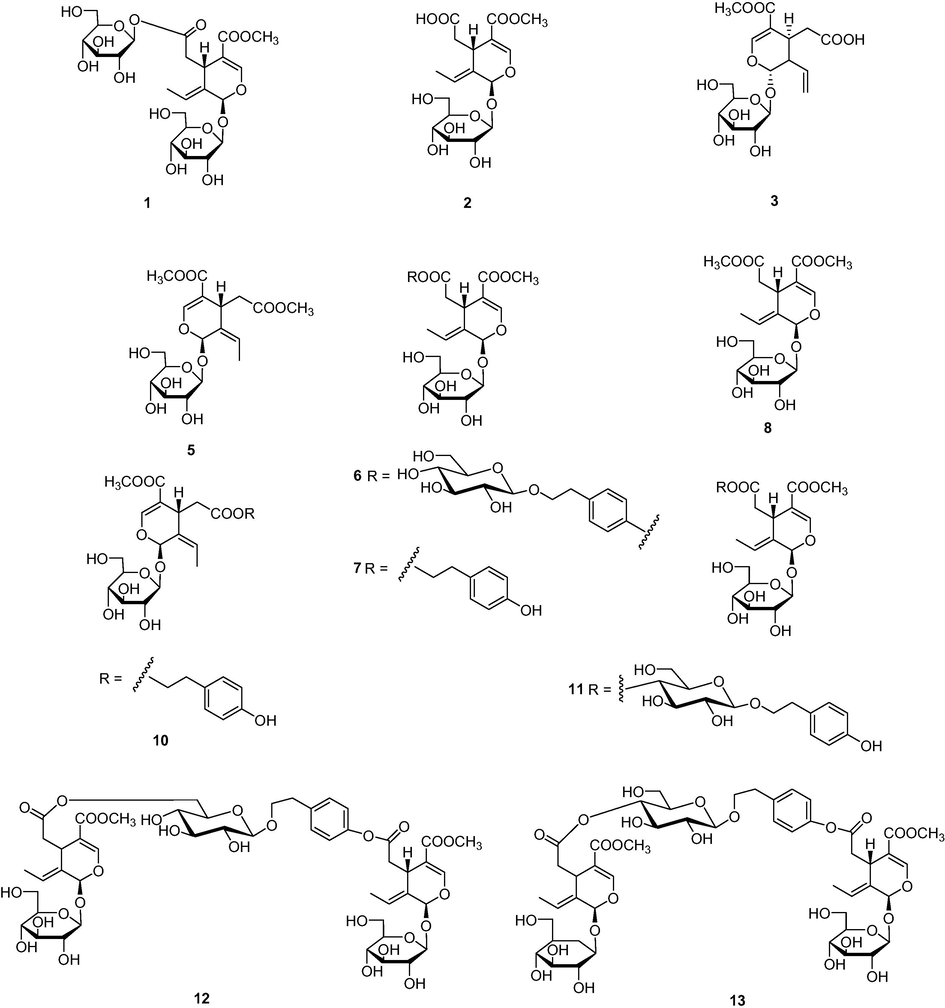
Chemical structures of iridoid glucosides identified from the OFA fruit.
No.
tR
Tentative assignment
Molecular formula
Exptlc (m/z)
Errord (ppm)
MS/MS (m/z)
[M+H]+
[M+NH4]+
a1
10.87
7-β-D-glucopyransoyl-11-methyloleoside
C23H34O16
584.21875
0.4102
405.1385, 387.1284, 369.1182, 243.0871, 225.0759, 165.0548, 151.0391, 127.0390
a2
11.97
Oleoside-11-methyl ester
C17H24O11
405.13922
0.2054
243.0867, 225. 0758, 211.0604, 197.0812, 165.0548, 151.0391, 141.0547, 121.0649
a3
13.71
Secoxyloganin
C17H24O11
405.13922
0.2054
243.0865, 225.0758, 243.0865, 211.0604, 197.0812, 165.0548, 151.0391, 123.0438
b4
15.82
Oleoside dimethylester isomer
C18H26O11
419.15469
−0.2252
257.1022, 239.0916, 225.0759, 193. 0498, 165.0548, 151.0391, 95.0492
a,b5
16.48
(8Z)-Oleoside dimethylester
C18H26O11
419.15506
0.6484
257.1022, 239.0916, 225.0759, 193.0498, 165.0548, 151.0391, 85.0284
a6
16.58
Nicotiflorine
C31H42O17
704.27582
−0.2943
507.1863, 387.1288, 369.1182, 295.0809, 225.0758, 211.0604, 165.0547, 151.0391, 121.0651
a7
16.60
(8E)-ligstroside
C25H32O12
525.19684
0.3533
387.1289, 369.1183, 295.0804, 243.0868, 225.0758, 193.0498, 165.0548, 151.0391, 123.0648
a,b8
16.77
(8E)-Oleoside dimethylester
C18H26O11
419.15485
0.1388
257.1022, 239.0916, 225.0759, 193.0497, 165.0548 151.0391, 85.0283
b9
17.30
Nuezhenide isomer
C31H42O17
704.27582
−0.2943
507.1869, 369.1182, 345.1333, 225.0758, 211.0604, 165.0547, 151.0391, 121.0648
b10
17.54
(8Z)-ligstroside
C25H32O12
525.19702
0.7020
387.1289, 369.1183, 295.0804, 243.0864, 225.0758, 193.0498, 165.0548, 151.0391, 123.0441
a11
17.54
Nuezhenide
C31H42O17
704.27606
0.0523
507.1868, 387.1288, 369. 1182, 225.0758, 211.0604, 165.0547, 151.0391, 121.0652
a12
19.30
G13
C48H64O27
1090.39734
0.01562
893.2994, 713.2440, 575.1755, 387.1288, 369.1182, 225.0758, 165.0548, 151.0391
b13
20.04
Liguosides A
C48H64O27
1090.39771
0.35147
893.2994, 713.2440, 531.1693, 387.1288, 369.1182, 225.0758, 165.0548, 151.0391
Compound 1 gave a [M+NH4]+ ion at m/z 584.21875 (tR 10.87 min) in the full scan mass spectrum, which was deduced as a glucopyransoyl-substituted oleoside-11-methyl ester. It exhibited a parent ion at m/z 566 (C23H34O16), which generated major fragments at m/z 405.1385 (C17H25O11, [M-glucose residue+H]+) and 387.1284 (C17H23O10, [M-glucose+H]+) through the loss of a glucose residue (162 Da) or a glucose (180 Da). The fragment at m/z 387.1284 (C17H23O10) was subsequently yielded ions at m/z 225.0759 (C11H13O5) and 193.0496 (C10H9O4) (Figs. S3 and S9), indicative of the presence of a methyloleoside subunit. Moreover, the loss of the H2O group from C17H23O10 at 369.1182 (C17H21O9), together with the loss of a glucose residue (162 Da) from C17H25O11 at m/z 243.0871 (C11H15O6), was also observed. Thus, all of the fragmentation information led to the conclusion that 1 was 7-β-glucopyransoyl-11-methyloleoside, which was further confirmed by comparison to the authentic standard. Compounds 2 and 3 were both observed from the parent ion at m/z 405.13922 ([M+H]+, and their obtained ions in the MS/MS experiment at m/z 243.0867 (C11H15O6) and 243.0865 (C11H15O6) were ascribed to the neural losses of glucose residue (162 Da) and further produced a fragment at m/z 211.0604 (C10H11O5) by loss of CH3OH (32 Da) (Figs. S4 and S9), which is characteristic of an oleoside methyl ester. Moreover, both observed ions at m/z 225.0758 (C11H13O5) could be assigned as the methyloleoside aglycone. The fragment ion observed at m/z 165.0548 (C9H9O3) was due to another neural loss of CH3COOH (60 Da) from the aglycone component. Therefore, 2 and 3 were identified as oleoside-11-methyl ester and secoxyloganin, respectively, by comparison with the literature (Liao et al., 2018) and our previously isolated authentic standards (Tang et al., 2015).
Three isomers (4, 5, and 8) at tR = 15.82, 16.48, and 16.77 min revealed the [M+H]+ ions at m/z 419.15469, 419.15506, and 419.15485, respectively, establishing the same molecular structure of C18H26O11. Apart from the characteristic fragments of methyloleoside m/z 225.0759 (C11H13O5) and 193.0497 (C10H9O4) (Figs. S5 and S9), the dimethyloleoside aglycone motifs at m/z 239.0916 (C12H15O5) and m/z 257.1022 (C12H17O6), which arising from the neural loss of glucose (180 Da) and a glucose residue (162 Da) were also observed. Among them, peak 5 was identified as (8Z)-oleoside dimethyl ester by comparison to our previously isolated authentic standards (Tang et al., 2015), while peak 8 was identified as (8E)-oleoside dimethyl ester based on a commercial standard. However, peak 4 can be only indicated to be an isomer of oleoside dimethyl ester due to the limited information.
Nuezhenide (11) and G13 (12) were documented as the two major iridiods glycosides of OF fruit (Yang et al., 2013) and revealed parent ions at m/z 704.27606 [M+NH4]+ and 1090.39734 [M+NH4]+ in positive ion mode. In this study, three nuezhenide isomers (6, 9, and 11) were detected at tR 16.58, 17.30, and 17.54 min, respectively. All of these isomers displayed similar fragmentation patterns. The fragment at m/z 507.186 (C25H31O11) was attributed to the loss of a glucose moiety and was classified as the aglycone of nuezhenide. The typical fragment ions for methyloleoside (m/z 225.075, C11H13O5; 193.049, C10H9O4, and 165.054, C9H9O3, Figs. S6 and S9) were also generated in the MS/MS spectra in these isomers. Additionally, it should be noted that nuezhenide can be converted to salidroside after processing as a wine (Zhang et al., 2009). Therefore, the observed fragment ions at m/z 387.1288 (C17H23O10) in 6 and 11 were attributed to the loss of a salidroside subunit. Accordingly, 6 and 11 were deduced as nicotiflorine and nuezhenide, respectively, based on the literature (Liao et al., 2018) and by comparison to our previously isolated authentic standards (Tang et al., 2015). For 9, a key fragment of the ion at m/z 345.1333 (C19H21O6) suggested that the glucose moiety was located on another glucose component to form a diglucoside residue. According to the limited information, 9 can be only indicated to be an isomer of nuezhenide and was reported for the first time.
Two other derivatives were observed as [M+H]+ ions at m/z 525.19684 (7, tR 16.60 min) and m/z 525.19702 (10, tR 17.54 min) and were assigned as ligstroside isomers. The major fragment at m/z 387.1289 (C17H23O10) was attributed to the loss of hydroxyethyl phenol (C8H10O2), and further generated the product ion at m/z 225.0748 (C11H13O5) through the loss of glucose residue (162 Da). In addition, the fragment ion at m/z 165.0548 (C9H9O3) was indicative of the methyloleoside substructure in 7 and 10 (Figs. S7 and S8). Finally, 7 was identified as (8Z)-ligstroside by comparison to our previously isolated authentic standard (Tang et al., 2015), while 10 was confirmed as (8E)-ligstroside by reviewing the literature (Liao et al., 2018; Gao et al., 2013).
Two G13 analogues (12 and 13) were detected at 19.30 and 20.04 min. Structurally, G13 analogues are methyloleoside derivatives of nuezhenide, as further supported by the fragment ion at m/z 387.1288 (C17H23O10) from the MS/MS spectra (Figs. S8 and S9). The observed product ion at m/z 893.2994 (C42H53O21) was designated as the aglycone of G13 analogues, which further produced a fragment at m/z 713.2440 (C36H41O15) through the loss of a glucose (180 Da) moiety. The characteristic fragment ions of another methyloleoside motif were obtained at m/z 225.0758 (C11H13O5) and 165.0548 (C9H9O3) (Figs. S8 and S9). Thus, 12 and 13 could be identified as G13 and liguoside A according to those reported in literature (Liao et al., 2018; Gao et al., 2013) and the authentic standard.
3.4 Quantitative analysis of iridoid glucosides, phenylethanoid glycosides and flavonoids in OFA fruit
To further investigate on the phytochemical profiles of OFA fruit, three iridoid glycosides (nuezhenide, G13, and neonuezhenide), three phenylethanoid glycosides (salidroside, acteoside, and isoacteoside), and three flavonoids (quercetin, apigenin and kaempferol) were selected for quantitative analysis of OFA fruits. The typical chromatograms of these compounds in OFA fruit extract are presented in Fig. S10, and the contents are summarized in Table S4. The results showed that the major compounds for OFA fruits were nuezhenide and G13 with contents of 24.262 and 51.333 mg/g, respectively. This finding is consistent with previous work on quantification analysis of OF fruit (Yang, et al., 2013). For the phenylethanoid glycosides, salidroside was the most abundant constituent (12.883 mg/g), followed by acteoside (0.674 mg/g) and isoacteoside (2.133 mg/g). Notably, the contents of three flavonoids are relatively low and can be viewed as minor components in OF fruits. Therefore, nuezhenide, G13, and salidroside are preferable for selection for the quality evaluation of OFA fruits.
3.5 Anti-inflammatory activity of OFA fruit in CuSO4-induced zebra fish model
OF fruit has been traditionally documented as a folk decoction for treatment of cardiodynia and relief of stomach ache. Previous studies have also reported that OF fruit extract had anti-inflammatory activity (Li et al., 2013). However, evaluation of the anti-inflammatory activity of OF extract in a zebra fish model has been lacking until now. CuSO4 is a chemical substance that causes acute inflammation in the zebra fish screening model and is characterized by the rapid migration of macrophages to the nerve eminence. By counting the number of macrophages surrounding the nerve eminence, we can evaluate the anti-inflammatory activity of the OFA fruit extract. As shown in Fig. 4A and B, the low concentration of OFA fruit extract group (5 μg/mL) significantly reduced the number of macrophages compared with the model group and control group, whereas the moderate concentration group (10 μg/mL) and high concentration group (50 μg/mL) showed only marked differences compared with the control group, but no significant differences observed compared with the model group. The above results suggest that the OFA fruit extract displayed an anti-inflammatory activity in the CuSO4-induced zebra fish model. The OFA extract had anti-inflammatory activity only at low concentration, might be due to the toxicity effects of the OFA extract on zebra fish when treated at high concentrations, e.g., pericardial edema effect. Sivamani et al. (2014) conducted an investigation on anti-inflammatory activity of Withania somnifera leaf extract in stainless steel implant induces zebra fish and noticed that the thin layer chromatography separated portion had significant inhibition of TNF-α factor due to rich phenolic acids and flavonoids. Ekambaram et al. (2017) evaluated the anti-inflammatory effect of ethanol extract of Naravelia zeylanica DS (ENZ) on carrageenan-induced zebra fish model, and revealed that the administration of ENZ with 350 mg/kg dose displayed marked reduction in the expression of TNF- and iNOS factors. The anti-inflammatory activity of Naravelia zeylanica might be contributed by the presence of triterpenes and steroids, particularly oleanolic acid. In our work, the investigation of the possible inhibitory mechanism of OFA fruit is ongoing. Notably, anti-inflammatory activity of OF fruit extract based on Institute of Cancer Research (ICR) mouse models also be reported (Li et al., 2013), but relationship between its biological activity and chemical composition was not mentioned. Iridiod glycosides was regarded as the main representative chemicals in OF fruit, in which nuezhenide and G13 were the two major iridiods glycosides. Hence, further studies are required to clarify the contribution of these two compounds to the anti-inflammatory activity of OFA fruit.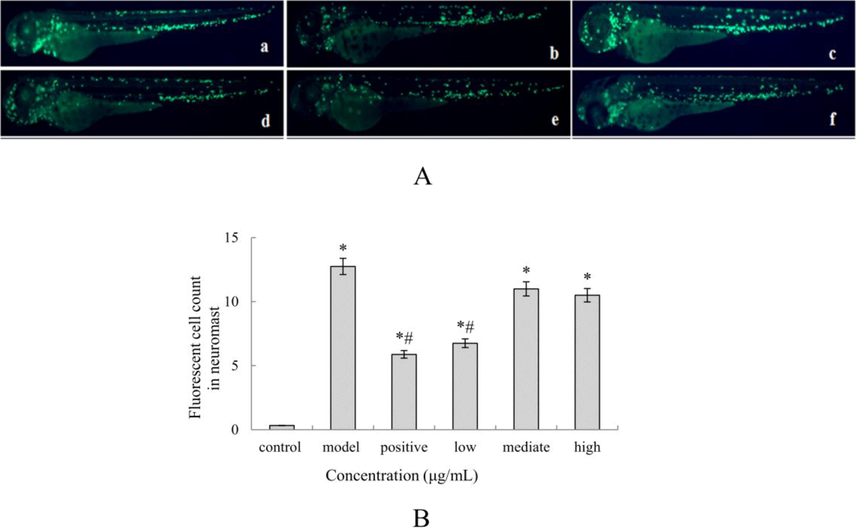
OFA fruit extracts alleviated the inflammation response in zebra fish after CuSO4 exposure. (A): Representative images of zebra fish treated with OFA extract and CuSO4: a. control group; b. model group; c. positive control; d. low OFA extract concentration group; e. mediate OFA extract concentration group; f: high OFA extract concentration group; (B): Macrophages in the region of the neuromast were quantitatively analyzed. The data are represented as the mean ± SE. *p < 0.05 vs. the control group, #p < 0.05 vs. the CuSO4 group.
4 Conclusions
In this study, simultaneously comparative optimization of UAE for four representative groups of OF fruits was first performed using RSM. The results demonstrated the extraction yields among the four types of OF fruits had no significant differences. The SEM results revealed that the UAE technique efficiently enhanced the release of chemical constituents by breaking down the cell structures. From the UPLC-ESI-MS/MS experiment, a total of 13 irioid glycosides were tentatively identified, wherein six irioid glycosides were discovered in OFA fruit for the first time. Finally, the biological evaluation results showed that OFA fruit extract at a concentration of 5 μg/mL could significantly reduce the number of the macrophages in a zebra fish model experiment. These results suggest that OFA fruit has promise in development as a functional additive in food industry and also supply a reference for its efficient utilization.
CRediT authorship contribution statement
Weizhuo Tang: Conceptualization, Methodology, Supervision, Writing - original draft, Writing - review & editing. : . Shuang Li: Investigation, Formal analysis, Data curation. Miaomiao Wang: Investigation, Software, Formal analysis, Data curation. Bin Wang: Writing - review & editing.
Acknowledgments
This research was supported by the Hunan Provincial Education Department Fund of Distinguished Younger Program (18B407), the Training Program for Excellent Young Innovators of Changsha (kq2009024) and the Natural Science Fund of Hunan Province (No. 2018JJ3567).
Declaration of Competing Interest
The authors declare that they have no known competing financial interests or personal relationships that could have appeared to influence the work reported in this paper.
References
- Lasianosides A-E: new iridoid glucosides from the leaves of Lasianthus verticillatus (Lour.) Merr. and their antioxidant activity. Molecules. 2019;24:3995.
- [Google Scholar]
- Efficient approach for the extraction and identification of red pigment from Zanthoxylum bungeanum maxim and its antioxidant Activity. Molecules. 2018;23:1109.
- [Google Scholar]
- Ultrasonic extraction and antioxidant activity of polyphenols from osmanthus fragrans fruits. Food Sci.. 2011;32:106-110.
- [Google Scholar]
- Optimization of ultrasound-assisted extraction of phenolic compounds from black locust (Robiniae Pseudoacaciae) flowers and comparison with conventional methods. Antioxidants. 2019;8:248.
- [Google Scholar]
- Anti-inflammatory effect of Naravelia zeylanica DC via suppression of inflammatory mediators in carrageenan-induced abdominal oedema in zebrafish model. Inflammopharmacology. 2017;25:147-158.
- [Google Scholar]
- Chemical constituents and biological activities of plants from the genus Ligustrum. Chem. Biodivers.. 2013;10:96-128.
- [Google Scholar]
- Microwave-assisted extraction of silkworm pupal oil and evaluation of its fatty acid composition, physicochemical properties and antioxidant activities. Food Chem.. 2017;231:348-355.
- [Google Scholar]
- Effects of ultrahigh pressure extraction on yield and antioxidant activity of chlorogenic acid and cynaroside extracted from flowers buds of Lonicera japonica. Chin. J. Nat. Med.. 2015;13:445-453.
- [Google Scholar]
- Antioxidant activities and UV-protective properties of melanin from the berry of Cinnamomum burmannii and Osmanthus fragrans. Med. Chem. Res.. 2011;20:475-481.
- [Google Scholar]
- Phenylethanoid glycoside profiles and antioxidant activities of Osmanthus fragrans Lour. flowers by UPLC/PDA/MS and simulated digestion model. J. Agr. Food Chem.. 2016;64:2459-2466.
- [Google Scholar]
- Optimization of ultrasound-assisted extraction of natural antioxidants from the Osmanthus fragrans flower. Molecules. 2016;21:218.
- [Google Scholar]
- Study on anti-inflammatory and analgesic effects of Gui Hua Zi. Zhongyao Yaoli Yu Linchuang. 2013;29:123-124.
- [Google Scholar]
- Tenacissoside H exerts an anti-inflammatory effect by regulating the nf-κb and p38 pathways in zebrafish. Fish Shellfish Immu.. 2018;83:205-212.
- [Google Scholar]
- Identification and quantitation of the bioactive components in Osmanthus fragrans fruits by HPLC-ESI-MS/MS. J. Agr. Food Chem.. 2018;66:359-367.
- [Google Scholar]
- Hepatoprotective iridoid glucosides from Callicarpa nudiflora. J. Asian Nat. Prod. Res.. 2016;18:274-279.
- [Google Scholar]
- Simultaneous extraction of phenolic compounds of citrus peel extract: Effect of ultrasound. Ultrason Sonochem.. 2009;16:57-62.
- [Google Scholar]
- New iridoid glucosides from Caryopteris incana (Thunb.) Miq. and their α-glucosidase inhibitory activities. Molecules. 2016;21:1749.
- [Google Scholar]
- Ultrasound-assisted extraction optimization of phenolic compounds from Citrus latifolia waste for chitosan bioactive nanoparticles development. Molecules. 2019;24:3541.
- [Google Scholar]
- Linaburiosides A-D, acylated iridoid glucosides from Linaria buriatica. Phytochem.. 2020;171:112247
- [Google Scholar]
- Extraction of triterpenoids and phenolic compounds from Ganoderma lucidum: optimization study using the response surface methodology. Food Funct.. 2018;9:209-226.
- [Google Scholar]
- Antioxidant activity and phytochemical composition of Osmanthus fragrans’ pulps. South African J. Botany.. 2015;98:162-166.
- [Google Scholar]
- Characterisation and free radical scavenging activities of novel red pigment from Osmanthus fragrans’ seeds. Food Chem.. 2009;112:909-913.
- [Google Scholar]
- Studies on the chemical components of the seeds of Osmanthus fragrans “Bayuegui”. Chin. J. Synthetic. Chem.. 2015;23:854-857.
- [Google Scholar]
- Optimization of ultrasound-assisted extraction of polyphenols from wheatgrass (Triticum aestivum L.) J. Food Sci. Tech.. 2020;57:2809-2818.
- [Google Scholar]
- Optimization study on extraction of antioxidants from plum seeds (Prums domestica L.) Optim. Eng.. 2021;22:141-158.
- [Google Scholar]
- Anti-inflammatory activity of Withania somnifera leaf extract in stainless steel implant induced inflammation in adult zebrafish. J. Gentic Eng. Biotech.. 2014;12:1-6.
- [Google Scholar]
- Osmanthus fragrans seeds, a source of secoiridoid glucosides and its antioxidizing and novel platelet-aggregation inhibiting function. J. Funct. Foods. 2015;14:337-344.
- [Google Scholar]
- Isolation and characterization of melanin from Osmanthus fragrans’ seeds. LWT-Food Sci. Technol.. 2006;39:496-502.
- [Google Scholar]
- Standard of classification and application of sweet Osmanthus. J. Zhejiang Agr. & Forestry. Univ.. 2004;21:281-284.
- [Google Scholar]
- Isolation and determinaiton of iridoid glycosides from the seeds of Osmanthus fragrans by HPLC. Analy. Lett.. 2013;46:745-752.
- [Google Scholar]
- Chemical constituents of Osmanthus fragrans fruits. Zhongguo Zhongyao Zazhi. 2013;38:4329-4334.
- [Google Scholar]
- Sequential combination of microwave and ultrasound assisted extraction of total flavonoids from Osmanthus fragrans Lour. flowers. Molecules. 2017;22:2216.
- [Google Scholar]
- Optimize the processing techonology of fructus Ligustri Lucidi with wine by orthogonal design. Zhongchengyao. 2009;31:1564-1567.
- [Google Scholar]
Appendix A
Supplementary material
Supplementary data to this article can be found online at https://doi.org/10.1016/j.arabjc.2021.103086.
Appendix A
Supplementary material
The following are the Supplementary data to this article:


