

Translate this page into:
A microwave-based technique to determine saccharides and polyols contents in Spirulina (Arthrospira platensis)
⁎Corresponding author. widiastuti.setyaningsih@ugm.ac.id (Widiastuti Setyaningsih)
-
Received: ,
Accepted: ,
This article was originally published by Elsevier and was migrated to Scientific Scholar after the change of Publisher.
Abstract
The growing demand for Spirulina (Arthrospira platensis) as a dietary supplement suggests that a rapid and reliable method to determine its saccharides and polyols content would be of great interest. Additionally, the impact of these microalga growing conditions may have on such content would be really useful for Spirulina producers. This manuscript presents the development and validation of a new analytical microwave-assisted extraction (MAE) method as the first step in determining saccharides and polyols in spirulina samples. A Box Behnken design has been employed to evaluate three extraction variables, viz., temperature (x1: 30, 55 and 80 °C), solvent composition (x2: 0, 25, and 50% ethanol in water), and solvent to sample ratio (x3: 10:1, 20:1, and 30:1 mL of solvent per g of sample). These extraction variables have been optimized by Response Surface Methodology (RSM). Under the optimal conditions that have been thereby established (i.e., 30 °C, 50% ethanol in water, and 30:1 solvent to sample ratio), a kinetic study has been performed with full recovery in 15 min. Subsequently, the developed MAE method was validated by determining the number of parameters, including linearity, LODs, LOQs, accuracy, and precision. Finally, the resulting MAE method was successfully applied to determine saccharides and polyols contents in a number of Spirulina samples that had been cultivated in varying salinity media. Five saccharides and polyols were identified in Spirulina, i.e., inositol, glycerol, sorbitol, glucose, and maltose. The total amount of the compounds of interest in the Spirulina that had been cultivated in a higher salinity media (17 and 25 g L−1 of sodium chloride in water) was six-folds higher than the one cultivated in low saline water (0 and 3 g L−1 of sodium chloride in water). This substantial content difference was mainly explained by the considerable increment in glycerol and glucose contents when grown in a more saline medium. Therefore, it has been demonstrated that the new method is suitable to determine saccharides and polyols contents in different Spirulina samples.
Keywords
Spirulina
Sugar
Extraction
Box-Behnken design
Salinity

1 Introduction
Spirulina (Arthrospira platensis) is mainly consumed as an alimentary supplement (Ma et al., 2019). This microscopic blue-green alga contains a number of interesting nutritional substances, including saccharides and polyols (Carrasco-Reinado et al., 2019; Chaiklahan et al., 2013). Glucose is one of the main saccharides found in Spirulina (Pyne et al., 2017; Shekharam et al., 1987) and is closely associated with the formation of cyanophyte starch in Spirulina. This starch is formed by glucose monomers linked by α-1,4-type glycosidic (Julius, 2018). Such a glycosidic bond facilitates sugar–protein interactions during the polymerization of phycocyanin, thus preventing pigment degradation (Hadiyanto et al., 2018). A stable green color indicates that Spirulina can be ideally used as a food ingredient (Hosseini et al., 2013).
It has also been experimentally demonstrated that Spirulina is not only an attractive food ingredient but also that thanks to its polysaccharides content, it exhibits anticarcinogenic properties (Hirahashi et al., 2002). The moiety of the crude extract of water-soluble polysaccharide after been hydrolyzed to the monosaccharides contains glucose, rhamnose, galactose, ribose, and xylose (Kurd and Samavati, 2015), whilst the concentrated alcoholic extracts revealed the presence of glucose, fructose, galactose, mannose, and other lower molecular weight carbohydrates. Additionally, polyalcohols (inositol, glycerol, sorbitol, and mannitol) are also present in the extract along with the saccharides (Carrasco-Reinado et al., 2019). The aforementioned polyols have formerly been used in the treatment of diverse pathologies such as diabetes mellitus, galactosemia, or bipolar depression (Bhagavan, 2002; Eden Evins et al., 2006).
The biochemical traits of Spirulina are strongly related to its growing conditions (Mutawie, 2015; Shalaby et al., 2010). Since the cultivation media is an essential growth factor, a large number of studies have focused on the influence of water salinity levels. Previous research studies have reported that a highly saline growing media produces Spirulina with an increasing concentration of carotenoids and lipids (Sujatha and Nagaran, 2014) as well as with a greater content of antioxidants with enhanced antiviral activity (Shalaby et al., 2010). On the contrary, the highly saline media also produces Spirulina with lower protein content (Hadiyanto et al., 2018; Hirahashi et al., 2002; Kurd and Samavati, 2015). A reliable determination method, therefore, is necessary to accurately quantify saccharides and polyols in Spirulina as a tool to monitor the quality of Spirulina grown under different conditions. Additionally, as mentioned above, the developed method could also assist with further research studies that intend to explore the benefits that the saccharides and polyols found in microalgae may provide as diet products or alimentary supplements.
As a first step to conceive a practical determination method for saccharide and polyols in Spirulina, a suitable analytical extraction should be developed. Although Soxhlet is the most commonly used extraction method, it presents some drawbacks in terms of economic viability, solvent consumption, and waste generation. Microwave-assisted extraction (MAE) based methods seem to present some advantages when compared to other traditional methods. This technique has already been demonstrated to be suitable for extracting a number of analytes from Spirulina (Aftari et al., 2017; Chew et al., 2019; Kalsum, 2019). When MAE is applied to a vegetable sample, the rapid generation of heat and pressure draws the analytes out of the matrix. Since exposure to high temperatures takes place in a short period of time, extract degradation is mostly avoided and greater compound recoveries are usually achieved.
Microwave exhibits a rapid increase in the volumetric heating so that the energy can penetrate the matrix; thus, the whole of the sample is evenly heated. This heating procedure is what really characterizes and makes microwaves a really different energy source when compared to conventional ones (Eskilsson and Björklund, 2000).
MAE efficiency is largely affected by solvent composition and solvent to sample ratio (Setyaningsih et al., 2015) since the solvent acts as the energy and mass transfer medium during the MAE process (Mandal et al., 2007). For this reason, these parameters should be optimized.
When the interactions between the different variables in an extraction process may have a substantial influence on the final result, a chemometric approach becomes a really practical way to outline a new extraction method. Contrarily to the one-factor-at-a-time experimental design, a factorial design would allow a more effective experiment and simultaneous evaluation of the variables and their interactions in an MAE (Aftari et al., 2017; Setyaningsih et al., 2012). For example, Box–Behnken design (BBD) allows a shorter number of runs than other factorial designs. Additionally, BBD is compatible with Response Surface Methodology (RSM), which would determine the optimal values for the parameters in the model (Ferreira et al., 2007).
Therefore, this study has applied a BBD in conjunction with RSM to optimize the variables in a microwave-assisted analytical extraction method. The optimized method was subsequently used to determine the saccharides and polyols contents in a number of samples obtained from Spirulina that had been cultivated in a range of media at specific salinity levels.
2 Materials and methods
2.1 Materials and reagents
Carbohydrate standards (analytical grade), HPLC-grade ethanol, sodium hydroxide (NaOH), and sodium acetate (NaOAc) were obtained from Sigma (Madrid, Spain). Water was filtered by means of a Milli-Q purification system (Millipore, Billerica, MA, USA).
2.2 Spirulina samples and growing conditions
A single strain of Spirulina (Arthrospira platensis) was acquired from the Microalgae Culture Collection at the Indonesian Institute of Sciences (Jakarta, Indonesia). The Spirulina stock culture was inoculated into 2 L autoclaved natural seawater enriched with modified Zarrouk medium for its nutrition (Figure S1). The culture was carried out under controlled conditions in four different tubes at the following salinity levels: pure distilled water and 3, 17, and 25 g L−1 of sodium chloride in water. These levels were prepared by diluting natural seawater (35 g L−1 of salt mostly containing sodium chloride (95–99%) in the solution) with distilled water. The culture was kept at a constant temperature between 25 and 26 °C and was exposed for 12 h light/dark alternative periods to 40 W cool-white fluorescent tubular LED lamps. The growing process of the Spirulina culture was monitored by counting the number of cells, and optimum growth was reached after approximately 12 days. According to an optimum exponential growth chart, all the cultures were scaled-up to 20 L culture medium. The culture conditions remained the same as before the scaling-up. A new growth chart was built and monitored to determine the harvesting time. After approximately 18 days, the culture reached its optimum growth point, and a semi-continuous culture system was set up. At this stage, the cultures were suitable for continuous harvesting. The cells from each harvest batch were directly frozen at –80 °C overnight before they were submitted to the freeze-drying process on the following day to produce the final Spirulina powder.
2.3 Extraction of saccharides and polyols
The Microwave-assisted Extractions (MAE) were conducted by means of a MARS 6 240/50 (CEM, Matthew, NC, USA) equipped with extraction vials manufactured in modified polytetrafluoroethylene (PTFE-TFM). The Spirulina samples were accurately weighed to match the solvent ratios established for the experiments, i.e., 10:1, 20:1, and 30:1 (mL of solvent per g of sample) and placed into extraction vials. These vials were filled with 15 mL of a solvent accurately composed of pure water or ethanol (25 or 50%) in water and then submitted to the corresponding temperature level within the experimental range (30, 55, or 80 °C). After the extraction had been completed, the vials were submerged to cool down into a water bath at 5 °C for 30 s until they reached room temperature. The solid matter in the samples was separated using filtering paper. The filtration cake was then rinsed using a different solvent, and the volume of the extract was adjusted to 25 mL. The extracts were then diluted at 1:10 in Milli-Q water and filtered through a 0.45 μm nylon filter (Millipore) before injecting into the HPAE–PAD system.
2.4 Identification and quantification of saccharides and polyols
The chromatographic analyses were carried out employing an ion chromatography system (Metrohm 930 Compact IC Flex) with a pulsed amperometric detector (HPAE-PAD) fitted with a golden electrode. The compounds were separated in a Metrosep Carb 2–150/4.0 column (Metrohm), and the analyses were recorded utilizing MagIC net® version 3.1 (Metrohm AG, Switzerland). The mobile phases were formed by 300 mM NaOH and 1 mM NaOAc. The injection volume was established at 20 µL. The elutions were submitted to isocratic conditions under a 0.5 mL min−1 flow rate. The saccharides and polyols contents in Spirulina samples were determined by comparing their retention times against the retention times of the pure standards.
2.5 Experimental design and statistical analysis
In order to determine the independent factors that might affect the efficiency of the microwave-assisted extraction (MAE) method, a Box Behnken design (BBD) was applied. Then, the variables were optimized by Response Surface Methodology in order to develop a second-order polynomial model. The BBD included three independent factors, x1, temperature, x2, solvent composition, and x3, solvent to sample ratio, at three different levels (−1, 0, 1) (Table 1). The experiments (Table 2) were carried out in random order. This methodology is intended to determine the influence of each independent factor as well as their interactions. Then, by adjusting the resulting data to a polynomial model, the corresponding surface response should be obtained. The final results in the RSM could be expressed as follows:
Factors
−1
0
+1
Unit
x1, extraction temperature
30
55
80
°C
x2, solvent composition
0
25
50
% ethanol in water
x3, solvent to sample ratio
10:1
20:1
30:1
(v/w)
Run
x1, temperature
x2, solvent composition
x3, solvent to sample ratio
Relative values to the maximum response (%)
1
0
1
−1
69.56
2
0
−1
1
91.45
3
1
−1
0
76.98
4
−1
0
1
90.01
5
0
−1
−1
64.93
6
0
0
0
69.82
7
0
0
0
71.79
8
−1
−1
0
76.40
9
−1
0
−1
77.53
10
0
0
0
67.24
11
1
0
1
92.67
12
1
0
−1
50.44
13
−1
1
0
100
14
1
1
0
39.81
15
0
1
1
84.68
Since the objective was to optimize the response (y), the best estimation for the correlation between the independent factors and the response surface had to be previously determined. A second-order model is generally used to calculate the RSM:
The regression coefficients were estimated by a least-square method where only up to the second-order interactions would be considered.
The implementation of the BBD and the modeling of the RSM were performed with the aid of STATGRAPHICS Centurion XVI (Statpoint Technologies, Inc., USA). These statistical tools model the response surface based on a particular quadratic model equation. The Analysis ToolPak that is provided with Excel by Microsoft Office was used to analyze the experimental data obtained from the one-factor-at-a-time method. The Analysis of Variance (ANOVA, p = 0.05) was used to determine the degree of influence of each variable of interest in the study. In those cases where ANOVA would point at a particularly significant difference, a Least Significant Difference (LSD, p < 0.05) test was applied to verify differences between average values.
2.6 Method performance
According to the ISO 17025 and ICH Guidelines Q2 (R1) (ICH, 2005; ISO, 2005), the developed method was validated. In detail, to evaluate the linearity of the method over a particular concentration interval, it was applied to five standards solutions of saccharides and polyols that had been elaborated at the following concentration intervals: 0.1–10 mg L−1 for inositol and sorbitol; 0.2–20 mg L−1 for glycerol and maltose; and 1–100 mg L−1 for glucose. The coefficient of determination (R2) obtained according to the resulting calibration curve ranged from 0.9923 (glycerol) to 0.9998 (maltose). The limit of detection (LOD) obtained ranged from 0.16 (inositol) to 2.09 mg L−1 (glycerol), while the limit of quantification (LOQ) ranged from 0.53 (inositol) to 6.97 mg L−1 (glycerol).
With regards to the method’s accuracy, unfortunately, no definite statements can be made since a certified reference material (CRM) for saccharides and polyols in Spirulina is not yet available. Nevertheless, a spiking method was employed to determine the extraction recovery (%R) and measure the stability of the studied analytes during the MAE process. For that purpose, some Spirulina samples were submitted to MAE in accordance with the previously established optimum conditions. The samples had been added 1 mL of a spiked mixture containing the standards of the compounds of interest. The spiked mixture was formed by inositol, glycerol, sorbitol, glucose, and maltose, and the concentration of each compound was similar to the level found in the Spirulina mix sample. The extraction recovery was calculated by comparing the levels of the spiked compounds found in the spiked samples with the actual level of the compounds in the spiked mixture.
The MAE method was also evaluated for repeatability (intra-day) and intermediate precision (extra-day). Repeatability was determined by performing nine extractions on the same day, while intermediate precision was determined by conducting three separate extractions on three consecutive days. The precision of MAE was expressed as the coefficient of variation (%CV) of the extraction yield.
3 Results and discussion
3.1 Identification of saccharides and polyols
Given that the chromatographic method (HPAE-PAD) used in this study does not provide specific information that allows the identification of chromatographic peaks; a careful identification of the compounds was conducted based on the retention times of the pure standards and the spiking method applied to real samples. As a preliminary study, a qualitative screening was performed to identify saccharides and polyols in a homogenous sample prepared using Spirulina that had been cultured in the water at different saline levels. For this purpose, 0.75 g of Spirulina powder was extracted at 55 °C using 25 mL of ethanol in water (1:3), and the extract was analyzed by the HPAE-PAD system. The performance of the HPAE-PAD method, including linearity, range, precisions, detection and quantification limits, was evaluated and the results have been included in Table 3.
Compound
Range (mg L−1)
Linear equation
R2
LOD (mg L−1)
LOQ (mg L−1)
Inositol
0.1–10
y = 99.9011x + 7.8016
0.9998
0.160
0.534
Glycerol
0.1–10
y = 9.9943x + 12.8568
0.9995
0.274
0.914
Sorbitol
0.2–10
y = 73.42834x + 0.3897
0.9923
2.091
6.968
Glucose
1–100
y = 54.5704x + 26.5239
0.9998
1.633
5.444
Maltose
0.2–20
y = 47.82173x + 1.52174
0.9998
0.303
1.002
Twenty standard compounds, i.e., arabitol, erythritol, galactitol, glycerol, inositol, maltitol, mannitol, ribitol, sorbitol, xylitol, arabinose, fructose, galactose, glucose, lactose, maltose, mannose, rhamnose, saccharose, and xylose were used as references. By comparing the retention time of those standards with the peaks that appeared in the chromatogram obtained by HPAE-PAD, five saccharides were identified in the Spirulina mix sample: inositol, glycerol, sorbitol, glucose, and maltose. Based on the LOD of the HPAE-PAD method when applied to the standards, it could be concluded that the contents of the 15 missing compounds (arabitol, erythritol, galactitol, maltitol, mannitol, ribitol, xylitol, arabinose, fructose, galactose, lactose, maltose, rhamnose, saccharose, and xylose) were below 0.320 mg kg−1 in the Spirulina sample. The identified compounds were confirmed by spiking 1 mg of corresponding standard solution providing similar levels to the 50% of the levels in the Spirulina mix sample. No new peaks appeared in the chromatogram.
3.2 Influence of the extraction factors
The extraction factors that may influence Microwave-assisted Extraction (MAE) efficiency and that have been studied in this research include temperature (x1), solvent composition (x2), and solvent to sample ratio (x3). Since those extraction factors have different values, units, and ranges, each factor value were normalized within a domain ranging from −1 to +1 to obtain a more even response (Baş et al., 2007). The normalized factors were then evaluated for their effects on the extraction yield by a Box Behnken design (BBD).
A BBD with 15 experimental units, including three center points, was performed. The responses for the BBD were established at the relative values to the maximum peak area of glycerol. This compound was selected because it provided adequate response signals to the BBD (Table 2). Then, the influence of temperature (x1), solvent composition (x2), and solvent to sample ratio (x3) was evaluated based on an analysis of variance (ANOVA). The mean square against an estimate of the experimental error was used to determine the statistical significance of the influence obtained for each one of the relevant extraction variables. The standardized values of the main, interactive, and quadratic effects are charted in a Pareto chart (Fig. 1). The factors with a significant effect on the response (p < 0.05) have been indicated by crossing a vertical line. According to these results, two main effects (x1 and x3), two interaction effects (x1x2 and x1x3), and a quadratic effect (x3x3) with p-values lower than 0.05 have a significant influence on the extraction efficiency.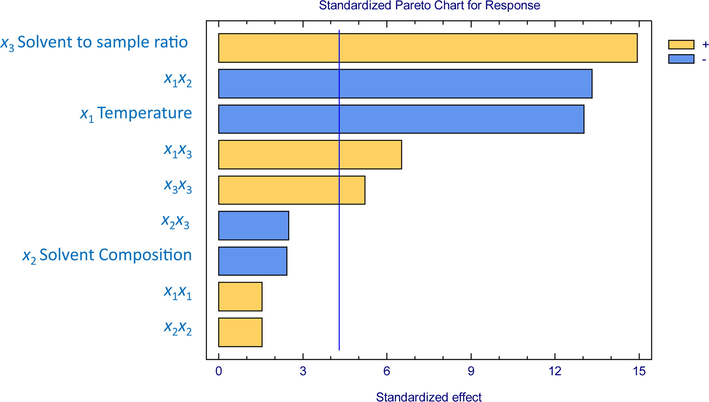
Standardized values of main, interaction, and quadratic effects of MAE factors on the extraction yield.
In regards to the Pareto chart, the solvent to sample ratio presented a positive effect on extraction efficiency, i.e., the higher the solvent to sample ratio, the higher the extraction yield. On the contrary, a negative effect can be attributed to temperature, where lower temperature levels would give place to greater saccharide and polyols extractions. Furthermore, the interaction between temperature and solvent composition seemed to affect the recoveries negatively. Nevertheless, the optimal set up of the model was carried out based on the contribution of all factors according to the following formula:
Lack-of-fit was calculated according to the variability of the current model residuals and the variability between observations at replicate settings. Since the p-value was 0.08 for the lack-of-fit in ANOVA, the model was confirmed to be adequate with a 95.0% confidence level for the observed data. According to the R2, it was concluded that the fitted model explains 94.38% of the response variability, where the residual standard deviation was 2.28, and their average absolute error was 3.10. Hence, the suggested model was confirmed to be suitable to determine the optimum MAE conditions to achieve a maximum extraction yield.
3.3 Response optimization
A three-dimensional mesh plot that would allow predicting the relationships between independent and dependent factors was constructed. Response surface methodology (RSM) was used to plot a yield prediction surface graph based on the variations of the extraction factors considered in the study, viz. temperature (x1), solvent composition (x2), and solvent to sample ratio (x3) (Fig. 2). The highest response level with a 104% MAE yield was located at −0.99, 0.99, and 1.00 for x1, x2, and x3, respectively. According to this, the optimum MAE conditions for saccharide and polyols extraction would be established as 30 °C temperature, 50% ethanol in water, and 30:1 solvent-to-sample ratio.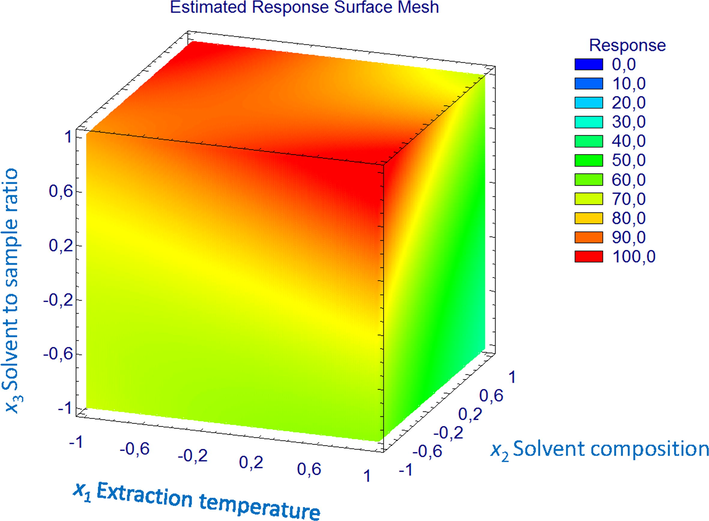
A 3D mesh of response plot for the studied MAE factors.
3.4 Kinetics study
According to the optimum condition previously established for MAE, the optimum kinetics condition for the extraction of saccharides and polyols from Spirulina samples was determined by verifying the yields obtained at specific time intervals. The different kinetics extraction efficiencies were determined as the average of the maximum yields obtained of the five compounds of interest over varying extraction time intervals that ranged from 5 to 30 min. Fig. 3 shows the plot of the extraction yields over the extraction time. The ANOVA applied to the results from the extraction yields suggested that the extraction time significantly influenced the extraction efficiency (p < 0.05). Accordingly, the 15 min extraction time seemed to present the best extraction yield (LSD, p < 0.05) compared to even longer extraction times. Therefore, 15 min was established as the optimal extraction time.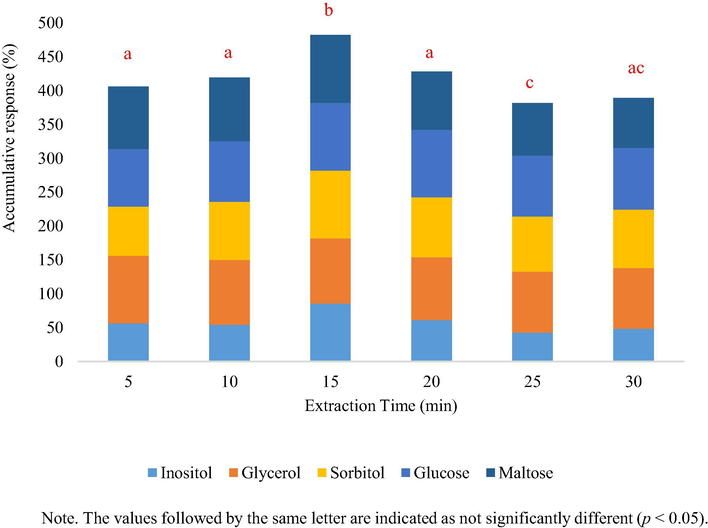
Extraction yield versus extraction time.
3.5 Method validation
The repeatability and intermediate precision of the new MAE method were validated by extracting saccharides and polyols from Spirulina under the previously established optimal condition. The precision of the MAE method was evaluated for intra-day (repeatability) and inter-day (intermediate precision) extractions. In accordance with ICH guidelines, the precision was expressed as the coefficient of variation (CV, %). In fact, the CV values for precision were 10% or lower in all the cases, ranging from 0.66% up to 0.94% (intra-day and inter-day variation, respectively) in the case of glycerol and from 7.03% up to 10.08% for inositol extractions (Table S1). According to these results, the developed MAE method had been validated with regards to repeatability and intermediate precision when applied to the extraction of saccharides and polyols from Spirulina samples.
The accuracy of the MAE method was evaluated by comparing the peak areas of the studied compounds in both spiked and control samples after the extraction procedure. The extraction recoveries by the developed MAE ranged from 84.51% (sorbitol) to 93.79% (inositol). These results are satisfactory for the extraction of saccharides and polyols from Spirulina by MAE.
3.6 Application to real samples
The optimized and validated method was applied to determine saccharides and polyols contents in real samples in the interest to check the method applicability. The real samples were taken from the Spirulina cultures that had been grown at four different salinity levels: 0, 3, 17, and 25 g L−1 of sodium chloride in water. The levels of inositol, glycerol, sorbitol, glucose, and maltose in the Spirulina samples determined by the MAE method that had been developed are compiled in Table 4. Note. The total values followed by different letters are indicated as significantly different (p < 0.05) for different salinity.
Salinity (g NaCl L−1)
Saccharides and polyols (mg Kg−1)
Total (mg Kg−1)
Inositol
Glycerol
Sorbitol
Glucose
Maltose
0
37.24 ± 0.52
1491.97 ± 31.36
1152.17 ± 53.74
908.95 ± 45.68
38.98 ± 11.76
3629.31a
3
37.83 ± 6.43
1945.69 ± 178.95
657.34 ± 39.85
2149.49 ± 94.98
31.45 ± 3.07
4821.80b
17
40.59 ± 3.53
16091.02 ± 262.41
2601.92 ± 48.18
11596.64 ± 278.45
45.13 ± 1.97
30375.30c
25
44.70 ± 7.22
15538.51 ± 383.86
2536.08 ± 66.46
11304.69 ± 218.55
49.89 ± 7.99
29473.87d
Salt stress usually negatively affects the growth of land plants by reducing their biomass or their bioactive compound contents (Kirrolia et al., 2011; Tambiev et al., 2011). In contrast, microalgae react by adapting to salt and other stress condition, especially in terms of polysaccharides content (Aftari et al., 2017). A study performed by Zeng and Vonshak (Zeng and Vonshak, 1998) reported that highly saline media would favor Spirulina photosynthesis processes. This increment of the photosynthesis process would give place to a greater presence of glucose and other photosynthesis products. Other research studies have been conducted on the effect of salt stress on algae. Particularly, a study by Hiremath and Mathad (2010) demonstrated that increasing salt concentration in Chlorella vulgaris culture medium beyond a particular level would result in an increment of its carbohydrate contents. Another green microalga, Scenedesmus obliquus, was also evaluated for salt stress by El-Katony and El-Adl (2019), who reported an increased value in soluble saccharides contents as the salinity of the growing medium went up.
The ANOVA completed over this study has revealed that different water salinity produced statistically significant differences between the final saccharides and polyols contents in Spirulina (p < 0.05). According to the LSD, the content levels of the studied compounds in Spirulina showed a significant escalation (p < 0.05) in line with salinity increments. Such content went up from 4.82 to 30.38 g kg−1, where the most significant increments were explained by glycerol and glucose contents, which increased by 10- and 5-fold, respectively. Furthermore, sorbitol content levels also doubled when the Spirulina samples had been cultured under highly saline conditions (17–25 g L−1). In this line, Hiremath and Mathad (2010) reported that stress conditions might stimulate the synthesis of carbohydrates since soluble saccharides play an essential role in the osmotic regulation of cells under stress conditions.
4 Conclusions
The developed MAE method allows rapid and accurate extraction of the saccharides and polyols present in Spirulina. A Box Behnken design was used in combination with Response Surface Methodology for the optimization of the method, and the extraction kinetics of the saccharides and polyols found in Spirulina, i.e., inositol, glycerol, sorbitol, glucose, and maltose, was assessed. The optimum conditions for the MAE method to extract the five studied compounds were determined as 15 min extraction time, at 30 °C, using 50% ethanol in water and a solvent-sample ratio of 30:1. The developed method demonstrated suitable precision with coefficients of variation ≤10%. The proposed MAE method was successfully used to determine saccharides and polyols contents in Spirulina samples that had been cultured in the water at different salinity levels. The total amounts of saccharides and polyols in Spirulina grown in 17 and 25 g L−1 saltwater were more than six times higher than those grown in 0 and 3 g L−1. The results indicate that the increase of the water's salinity in a growing medium improved the final levels of saccharides and polyols contents in Spirulina. The concentration of glycerol and glucose, in particular, showed the most significant increase when Spirulina was grown in media with high levels of salinity.
CRediT authorship contribution statement
Rohmah Nur Fathimah: Investigation, Formal analysis, Writing - original draft. Widiastuti Setyaningsih: Conceptualization, Methodology, Formal analysis, Writing - original draft, Funding acquisition. Ceferino A. Carrera: Supervision, Writing - review & editing. Annisa Dwi Astari: Writing - review & editing, Project administration. Rudiati Evi Masithoh: Visualization, Writing - review & editing. Indyaswan Tegar Suryaningtyas: Resources, Writing - review & editing. Miguel Palma: Conceptualization, Validation, Writing - review & editing.
Acknowledgments
Widiastuti Setyaningsih would like to thank the Faculty of Agricultural Technology, Universitas Gadjah Mada, Indonesia, for the financial support through the Synergy Research Grant No. 2602/UNI.FTP.1.3/SET-D/KU/2019. This research was also partially funded through a Productive Innovative Research (RISPRO)-Mandatory 2020 Grant No. KEP-32/LPDP/2020 provided by the Endowment Fund For Education (LPDP), Ministry of Finance of Republic of Indonesia.
Declaration of Competing Interest
The authors declare that they have no known competing financial interests or personal relationships that could have appeared to influence the work reported in this paper.
References
- Antioxidant activity optimisation of Spirulina platensis C-phycocyanin obtained by freeze-thaw, microwave-assisted and ultrasound-assisted extraction methods. Qual. Assur. Saf. Crop. Foods. 2017;9:1-9.
- [CrossRef] [Google Scholar]
- Modeling and optimization I: usability of response surface methodology. J. Food Eng.. 2007;78:836-845.
- [Google Scholar]
- Bhagavan, N.V., 2002. Simple Carbohydrates. In: Donaghy, N. (Ed.), Medical Biochemistry. Elsevier, Canada, pp. 133–151. https://doi.org/10.1016/B978-012095440-7/50011-1.
- Valorization of microalgae biomass as a potential source of high-value sugars and polyalcohols. Lwt. 2019;114:108385
- [CrossRef] [Google Scholar]
- Polysaccharide extraction from Spirulina sp. and its antioxidant capacity. Int. J. Biol. Macromol.. 2013;58:73-78.
- [CrossRef] [Google Scholar]
- Enhanced microalgal protein extraction and purification using sustainable microwave-assisted multiphase partitioning technique. Chem. Eng. J.. 2019;367:1-8.
- [CrossRef] [Google Scholar]
- Inositol augmentation of lithium or valproate for bipolar depression. Bipolar Disord.. 2006;8:168-174.
- [CrossRef] [Google Scholar]
- Salt response of the freshwater microalga Scenedesmus obliquus (Turp.) Kutz is modulated by the algal growth phase. J. Oceanol. Limnol. 2019
- [CrossRef] [Google Scholar]
- Analytical-scale microwave-assisted extraction. J. Chromatogr. A. 2000;902:227-250.
- [Google Scholar]
- Box-Behnken design: an alternative for the optimization of analytical methods. Anal. Chim. Acta. 2007;597:179-186.
- [CrossRef] [Google Scholar]
- Hadiyanto, Christwardana, M., Sutanto, H., Suzery, M., Amelia, D., Aritonang, R.F., 2018. Kinetic study on the effects of sugar addition on the thermal degradation of phycocyanin from Spirulina sp. Food Biosci. 22, 85–90. https://doi.org/10.1016/j.fbio.2018.01.007.
- Activation of the human innate immune system by Spirulina: augmentation of interferon production and NK cytotoxicity by oral administration of hot water extract of Spirulina platensis. Int. Immunopharmacol.. 2002;2:423-434.
- [CrossRef] [Google Scholar]
- Impact of salinity on the physiological and biochemical traits of Chlorella vulgaris Beijerinck. J. Algal Biomass Util.. 2010;1:51-59.
- [Google Scholar]
- Spirulina paltensis: food and Function. Curr. Nutr. Food Sci.. 2013;9:189-193.
- [CrossRef] [Google Scholar]
- ICH, 2005. ICH Topic Q2 (R1) Validation of Analytical Procedures: Text and Methodology. Geneva, Switzerland.
- ISO, 2005. ISO/IEC 17025:2005 General requirements for the competence of testing and calibration laboratories. Geneva, Switzerland.
- Lipid extraction from Spirulina platensis using microwave for biodiesel production. Korean Chem. Eng. Res.. 2019;57:301-304.
- [CrossRef] [Google Scholar]
- Salinity as a factor affecting the physiological and biochemical traits of Scenedesmus quadricauda. Biomass. 2011;2:28-34.
- [Google Scholar]
- Water soluble polysaccharides from Spirulina platensis: extraction and in vitro anti-cancer activity. Int. J. Biol. Macromol.. 2015;74:498-506.
- [CrossRef] [Google Scholar]
- Fresh living Arthrospira as dietary supplements: current status and challenges. Trends Food Sci. Technol.. 2019;88:439-444.
- [CrossRef] [Google Scholar]
- Mandal, V., Mohan, Y., Hemalatha, S., 2007. Microwave Assisted Extraction – An Innovative and Promising Extraction Tool for Medicinal Plant Research 1.
- Carbohydrate diversity in microalgae: a phylogenetically arranged presentation. In: Levine I., Fleurence J., eds. Microalgae in Health and Disease Prevention. London, United Kingdom: Academic Press; 2018. p. :133-142.
- [Google Scholar]
- Growth and metabolic response of the filamentous cyanobacterium Spirulina platensis to salinity stress of sodium chloride. Life Sci. J.. 2015;12
- [Google Scholar]
- Microalgae (Spirulina Platensis) and its bioactive molecules : review. Indian J. Nutr.. 2017;4:1-6.
- [Google Scholar]
- A new microwave-assisted extraction method for melatonin determination in rice grains. J. Cereal Sci.. 2012;56:340-346.
- [CrossRef] [Google Scholar]
- Optimisation and validation of the microwave-assisted extraction of phenolic compounds from rice grains. Food Chem.. 2015;169:141-149.
- [CrossRef] [Google Scholar]
- Salt stress enhancement of antioxidant and antiviral efficiency of Spirulina platensis. J. Med. Plants Res.. 2010;4:2622-2632.
- [Google Scholar]
- Carbohydrate composition and characterization of two unusual sugars from the blue green alga Spirulina platensis. Phytochemistry. 1987;26:2267-2269.
- [CrossRef] [Google Scholar]
- Effect of salinity on biomass and biochemical constituents of Spirulina platensis (Geitler) Int. J. Plant Prot.. 2014;7:71-73.
- [Google Scholar]
- Manifestation of salt tolerance of Spirulina platensis and Spirulina maxima cyanobacteria of the genus Arthrospira (Spirulina) Moscow Univ. Biol. Sci. Bull.. 2011;66:133-137.
- [CrossRef] [Google Scholar]
- Adaptation of Spirulina platensis to salinity-stress. Comp. Biochem. Physiol. - A Mol. Integr. Physiol.. 1998;120:113-118.
- [CrossRef] [Google Scholar]
Appendix A
Supplementary data
Supplementary data to this article can be found online at https://doi.org/10.1016/j.arabjc.2021.103094.
Appendix A
Supplementary data
The following are the Supplementary data to this article:


