

Translate this page into:
Choline chloride-urea-based natural deep eutectic solvent for highly efficient extraction of polyphenolic antioxidants from Pluchea indica (L.) Less leaves
⁎Corresponding author. munim@farmasi.ui.ac.id (Abdul Mun'im)
-
Received: ,
Accepted: ,
This article was originally published by Elsevier and was migrated to Scientific Scholar after the change of Publisher.
Peer review under responsibility of King Saud University.
Abstract
Abstract
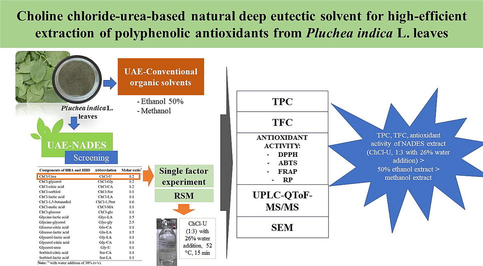
Pluchea indica leaves (PIL) is a polyphenolic-rich plant. Polyphenols, such as phenolics and flavonoids, are natural antioxidants. This study aims to evaluate the ability of natural deep eutectic solvent (NADES) based on ultrasonic-assisted extraction (UAE) for highly efficient extraction of the polyphenolic antioxidant compounds from PIL. Choline chloride-urea (ChCl-U) was selected based on screening of 17 types of NADES. This study uses Response Surface Methodology (RSM) to help determine optimal extraction conditions. The selected variables include molar ratio, temperature, and the water addition in the NADES. The responses used for the RSM study were total phenolic content (TPC), total flavonoid content (TFC), and antioxidant activity using 2,2-diphenyl-1-picrylhydrazyl (DPPH), ferric reducing antioxidant power (FRAP), 2,2′-azinobis (3-ethylbenzothiazoline-6-sulfonic acid) (ABTS), and reducing power (RP) methods with microtiter analysis. The best condition for polyphenolic antioxidants extraction using ChCl-U NADES was a 1:3 molar ratio, temperature of 52 °C, and 26% of water addition in NADES. Under these conditions, the extraction of total phenolics and flavonoids from PIL with antioxidant activity increased up to 1.2 folds and 3.1 folds compared with 50%-ethanol and methanol, respectively. The morphology of the leaves before and after extraction was also evaluated with a scanning electron microscope (SEM) to observe the effects of ultrasonic vibrations with different solvents. Furthermore, the compound di-caffeoylquinic acid (DCQA) in PIL was selectively found in ChCl-U extract through quadrupole time-of-flight mass spectrometry (UPLC-QToF-MS/MS) analysis. Thus, ChCl-U combined with UAE can be developed for polyphenolic extraction from PIL for extract production as an antioxidant.
Keywords
Asteraceae
Caffeoylquinic acid
Beluntas
Phenolics
Flavonoids
Green solvent

- ABTS
-
2,2′-azinobis (3-ethylbenzothiazoline-6-sulfonic acid)
- CQA
-
caffeoylquinic acid
- DCQA
-
di-caffeoylquinic acid
- DPPH
-
2,2-diphenyl-1-picrylhydrazyl
- FRAP
-
ferric reducing antioxidant power
- HAT
-
hydrogen atom transfer
- HBA
-
hydrogen bond acceptors
- HBD
-
hydrogen bond donors
- NADES
-
natural deep eutectic solvent
- MAE
-
microwave-assisted extraction
- PIL
-
Pluchea indica leaves
- RP
-
reducing power
- RSM
-
responses surface methodology
- SET
-
single electron transfer
- TCQA
-
tri-caffeoylquinic acid
- TFC
-
total flavonoid content
- TPC
-
total phenolic content
- UAE
-
ultrasonic assisted-extraction
- UPLC-QToF-MS/MS
-
ultra-performance liquid chromatography- quadrupole time-of-flight tandem mass spectrometry
Abbreviations
1 Introduction
Pluchea indica (L.) Less leaves (PIL) is one of the green vegetables (Andarwulan et al., 2010). The PIL is commonly consumed either as a fresh salad or decocting in water by the villagers of a Sundanese community in West Java, Indonesia (Roosita et al., 2008). In Thailand, PIL is consumed as a tea (Chewchida & Vongsak, 2019; Sudjaroen, 2012). PILs are reported to have pharmacological activities, such as anti-hyperlipidemia (Rahman et al., 2017; Sirichaiwetchakoon et al., 2020), antidiabetic (Arsiningtyas et al., 2014), anti-inflammatory (Suriyaphan, 2014), anti-bacterial (Srimoon & Ngiewthaisong, 2015), anti-fungal (Demolsky et al., 2022), anti-virus (Indrasetiawan et al., 2019; Wardani et al., 2018), and antioxidant (Andarwulan et al., 2010; Indradi et al., 2017; Vongsak et al., 2018). The benefits of PIL are related to its chemical components, including caffeic acid (Andarwulan et al., 2012), caffeoylquinic acids (CQA) (e.g., 3-CQA, 4-CQA, 5-CQA, 3,4-DCQA, 3,5-DCQA, and 4,5-DCQA) (Kongkiatpaiboon et al., 2018), flavonoids (myricetin, quercetin, kaempferol (Andarwulan et al., 2010), quercitrin, isoquercitrin, miquelianin, catechin, epicatechin, and astragalin (Hussin et al., 2019)), and volatile compounds (Widyawati et al., 2013). Phenolic compounds play a major role as an antioxidant from PIL (Vongsak et al., 2018). Previously, extracting phenolic antioxidants from PIL using 50%-ethanol and ultrasonic assist provided good results (Kongkiatpaiboon et al., 2018). Polyphenolic antioxidants are generally well extracted using alcohol (e.g., methanol, ethanol, ethanol–water, etc.) in combination with modern ultrasonic or microwave-assisted extraction techniques (Dai & Mumper, 2010; Khoddami A et al., 2013).
The selectivity of solvent for bioactive components is a critical point of plant extraction (Abubakar & Haque, 2020). Generally, organic solvents (e.g., methanol, ethanol, ethyl acetate, acetone, etc.) are used to extract plant metabolites (Tiwari et al., 2011). These solvents are mostly flammable and explosive. In addition, they are also volatile and play a role in air pollution pressure and accelerate global warming. These organic solvents can also leave waste that is difficult to recycle. It potentially damages the environment. Due to its toxicity, the solvent must evaporate from the extract. However, it requires a long operating stage and high energy (Chemat et al., 2019). For a good-quality extract, the residual solvent should be determined. The value must be below the specified threshold (World Health Organization, 2011). These reasons make using alternative solvents to extract plant metabolites crucial (Chemat et al., 2019). The use of alternative solvents in combination with modern extraction techniques aims to increase the efficiency and effectiveness of extraction procedures. It also impacts the quality of the extract produced (Vanda et al., 2019). One promising alternative solvents is natural deep eutectic solvents (NADES) (Dai et al., 2013). NADES is a solvent made from hydrogen bond acceptor (HBA)-hydrogen bond donor (HBD) components. These components are mixed with definite techniques to be eutectic form. NADES has many advantages, such as increased plant components’ extraction performance, bioactive compounds’ solubility, and biological activity (Hikmawanti et al., 2021). Several studies have reported the successful extraction of polyphenolic antioxidants from medicinal plants (e.g., Artemisia argyi leaves (Duan et al., 2019), Morus alba leaves (Gao et al., 2020), Lonicera japonica flower (Peng et al., 2016), Curcuma longa rhizome (Patil et al., 2021), Corylus avellana skin (Fanali et al., 2021), Citrus sinensis peel (Gómez-Urios et al., 2023), etc.) using choline-chloride (ChCl) based NADES. Extraction of polyphenolic antioxidants from PIL using NADES combined with ultrasonic-assisted extraction (UAE) has never been reported.
This initial study aimed to screen NADES suitable for extracting polyphenolics (total phenolics and flavonoids) from PIL. Furthermore, the selected NADES were optimized for their extraction conditions with the ultrasonic-assisted extraction (UAE) method to maximize the acquisition of total phenolic content (TPC), total flavonoid content (TFC), and antioxidant activity using the response surface methodology (RSM). The 50%-ethanol and methanol, volatile organic solvents, were used as comparators. This study also analysed the chemical components in the PIL extract using ultra-high performance liquid chromatography with quadrupole time-of-flight mass spectrometry (UPLC-QToF-MS/MS) system.
2 Material and methods
2.1 Chemicals
Gallic acid and quercetin as phenolic and flavonoid standards; Folin-Ciocalteu reagent, sodium carbonate (Na2CO3, ≥99.5 %), aluminium trichloride (AlCl3, ≥99 %), sodium acetate (CH3COONa, ≥99 %), methanol (≥99 %), ethanol absolute (≥99 %), Trolox (97 %), 2,2- diphenyl-1-picrylhyldrazyl radical (DPPH, >99.7 %), 2,4,6-tris(2-pyridyl)-s-triazine (TPTZ, >99.7 %), 2,2-azino-bis (3-ethylbenzothiazoline-6-sulfonic acid) diammonium salt (ABTS, ≥98 %), phosphate buffer, potassium ferricyanide (K3[Fe(CN)6], 99 %), hydrochloric acid (HCl, 37 %), trichloroacetic acid (TCA, ≥99 %), and ferric chloride (FeCl3, ≥99.99 %) were purchased from Sigma-Aldrich (St. Louis, USA). The components of NADES in this study include: choline chloride (ChCl) was ACS grade (≥90 %) from Xi'an Rongsheng Biotechnology Co, Ltd, China; citric acid anhydrous (CA, ≥ 99.7 %), D(-)-sorbitol (Sor, ≥ 99 %), D-(+)-glucose anhydrous (Glu, ≥ 99 %), and glycine (Glyc) from Himedia Laboratories Pvt. Ltd. (Maharashtra, India); urea (U, ≥99.5 %) dan glycerol (Gly, ≥99 %) from Vivantis Technologies (Selangor, Malaysia); lactic acid (LA, ACS grade ≥ 85 %), (±)-1,3-butanediol anhydrous (1,3-but, ≥99 %), and DL-malic acid (MA, ≥99 %) from Sigma-Aldrich (St. Louis, USA); and deionized water from Hanna Instruments SRL (Nusfalau, Romania). Chromatographic-grade water, ammonium formic, formic acid, and acetonitrile were purchased from Merck (Darmstadt, Germany).
2.2 Plant
The cultivated Pluchea indica L. leaves (PIL) with collection number: BMK0188092016 were obtained from the Center for Tropical Biopharmaceutical Studies (Trop BRC), Institut Pertanian Bogor (IPB) University, Bogor, Indonesia. The PIL harvested in May 2022. Authentication of the plant was carried out by the “Herbarium Bogoriense”, Directorate of Scientific Collection Management, National Research and Innovation Agency (Badan Riset dan Inovasi Nasional, BRIN), Cibinong, Indonesia (B-172/II.6.2/IR.01.02/2/2023). The fresh PIL was cleaned and then dried, protected from sunlight at 28–30 °C for three days. The dried PIL is ground to a powder. The PIL dried powder was sieved using a No.40 sieve to obtain powder particles with moderately coarse criteria of uniform size (<425 μm). Then, it was stored in an airtight container at room temperature until further analysis (Ministry of Health Republic of Indonesia, 2017).
2.3 Preparation of NADES as solvents
This study uses 17 types of NADES (Table 1). NADES was prepared using the heating-stirring method with a magnetic stirrer (Cimarec+™ Stirring Hotplates Series, Thermo Scientific, USA). In short, HBA-HBD at particular molar ratios was mixed in a glass vessel. Then, deionized water (30 %, v/v) was added to the total volume of NADES. The mixture was heated at 80 °C with a rotational speed of 1000 rpm until a clear and homogeneous solution was obtained. Finally, it is referred to as NADES. The characteristics of each NADES, including pH and viscosity, are determined at room temperature using a pH meter (HI 9124 HANNA Instruments, China) and viscometer (Visco QC300, Antonpaar, Graz, Austria), respectively. Note: *) with water addition of 30% (v/v).
Components of HBA and HBD
Abbreviation
Molar ratio*
ChCl-Urea
ChCl-U
1:2
ChCl-Glycerol
ChCl-Gly
1:2
ChCl-Citric Acid
ChCl-CA
1:2
ChCl-Sorbitol
ChCl-Sor
1:1
ChCl-Lactic Acid
ChCl-LA
1:1
ChCl-1,3-butanediol
ChCl-1,3but
1:6
ChCl-Malic Acid
ChCl-MA
1:1
ChCl-Glucose
ChCl-Glu
1:1
Glycine-Lactic Acid
Glyc-LA
1:5
Glycine-Glycerol
Glyc-Gly
2:5
Glucose-Citric Acid
Glu-CA
1:1
Glucose-Lactic Acid
Glu-LA
1:5
Glycerol-Lactic Acid
Gly-LA
1:1
Glycerol-Citric Acid
Gly-CA
1:1
Glycerol-Urea
Gly-U
1:1
Sorbitol-Citric Acid
Sor-CA
1:1
Sorbitol-Lactic Acid
Sor-LA
1:1
2.4 Preparation of the extracts
Extraction of polyphenolic antioxidants from the dried powder of PIL with NADES using the ultrasonic bath with a frequency of 40 KHz (Branson 5510, Shanghai, China). Initially, the dried powder of PIL (0.5 g) was added with NADES (10 ml). This mixture was extracted in an ultrasonic bath for 15 min at 40 °C (Kongkiatpaiboon et al., 2018), followed by centrifugation using Universal Centrifuge (Gemmy PLC-025, Taipei, Taiwan) at 4000 rpm for 20 min. The supernatant was collected and then filtered using Whatman filter paper no.41. Each NADES extract was stored in a dark container at 4 °C until further analysis.
In this study, 50%-ethanol and methanol, which are volatile organic solvents, were used as comparators. Separately, extraction of the dried powder of PIL (1 g) using the 50%-ethanol or methanol (20 ml) was performed using the same procedure to obtain 50%-ethanol (EE) and methanol extract (ME). All extraction procedures were carried out in triplicate.
2.5 Determination of total phenolic content (TPC)
This assay was performed in a flat bottom 96-well microplate using Folin-Ciocalteu reagent. Previously, PIL extracts were diluted 10 × with deionized water. Gallic acid was used as a standard (12.5 to 200 μg/ml). A total of 20 μl of sample was added into each well, followed by 100 μl of Folin-Ciocalteu reagent (1:10, diluted in distillate water), then shaken at medium speed for 1 min. After 4 min, the mixture was added with 75 μl of sodium carbonate (7.5 %, w/v). Then, the mixture was incubated for 2 h in the dark at room temperature. The absorbance was measured at 750 nm using an iMark microplate absorbance reader (BioRad, California, USA). Each corresponding solvent was used as a blank. The TPC was expressed as mg gallic acid equivalent per g dry weight (mg GAE/g DW) (Bobo-García et al., 2015). The procedures were performed in triplicate.
2.6 Determination of total flavonoid content (TFC)
Quercetin was standard in this assay (ranging from 12.5 to 200 μg/ml). PIL extracts were diluted 10 × with deionized water. A 50 μl extract or standard solution was added to each well of the flat bottom 96-well microplate. 10 μl of aluminium chloride (10 %, w/v), 150 μl of 96 % ethanol, and 10 μl of 1 M sodium acetate were added into each well. Each corresponding solvent was used as a blank. The absorbance was measured using an iMark microplate absorbance reader (BioRad, California, USA) at 415 nm after 40 min incubation at room temperature. The TFC was reported as mg quercetin equivalent per g dry weight (mg QE/g DW) (Sembiring et al., 2018). The procedures were performed in triplicate.
2.7 Determination of antioxidant activity
2.7.1 DPPH assay
DPPH reagent (0.1 mM) was prepared in methanol. NADES extract was diluted 10 × in deionized water for analysis. Quercetin was standard at different concentrations ranging from 0.083 to 0.660 mmol/L. A 20 μl sample and 180 μl of DPPH were mixed and shaken in a flat bottom 96-well microplate for 60 sec. After incubation for 30 min at room temperature in the dark room, the absorbance was measured using an iMark microplate absorbance reader (BioRad, California, USA) at 595 nm. The change from purple to yellow indicates the presence of DPPH radical scavenging activity (Khatua et al., 2017). Each corresponding solvent was used as a blank. The results were expressed as millimoles of quercetin equivalents (QE) per g of dry weight of the sample (mmol QE/g DW). The procedures were performed in triplicate.
2.7.2 Reducing power (RP) assay
In this assay, Trolox was used as standard at concentrations ranging from 0.05 to 0.8 mmol/L. NADES extract was diluted 10 × in deionized water for analysis. In a flat bottom 96-well microplate, 10 μl of sample, 25 μl of 0.2 M phosphate buffer (pH 6.6) and 25 μl of potassium ferricyanide (1 %, w/v) were mixed and gently shaken. After incubation for 20 min at room temperature, 25 μl of TCA (10 %, w/v) was added to the mixture. Then, 85 μl of distillation water and 8.5 μl of ferric chloride (0.1 %, w/v) were added to each well and gently shaken. After 15 min at room temperature, the absorbance was measured using an iMark microplate absorbance reader (BioRad, California, USA) at 750 nm. The change from yellow to turquoise indicates the reducing power of antioxidant compounds (Khatua et al., 2017). The results were expressed as millimoles of Trolox equivalents (TE) per g of dry weight of sample (mmol TE/g DW). Each corresponding solvent was used as a blank. The procedures were performed in triplicate.
2.7.3 FRAP assay
Briefly, the FRAP reagent was made by mixing 20 ml of acetate buffer (pH 3.6), 2 ml of TPTZ (10 mM, dissolved in 400 mM HCl), and 2 ml of ferric chloride (20 mM). Trolox was used as a standard ranging from 0.05 to 0.8 mmol/L. The assay was conducted as follows: 20 μl of sample was added with 245 μl of FRAP reagent in a flat bottom 96-well microplate. After 8 min incubation at room temperature, the absorbance was then measured using an iMark microplate absorbance reader (BioRad, California, USA) at 595 nm. The change from dark blue to colourless indicates the ferric-reducing power of antioxidant compounds. The results were expressed as millimoles of Trolox equivalents per g of dry weight of sample (mmol TE/g DW) (Jimenez-Alvarez et al., 2008). Each corresponding solvent was used as a blank. The procedures were performed in triplicate.
2.7.4 ABTS assay
Previously, radical cation ABTS (ABTS•+) was prepared from a mixture of ABTS (7 mM, dissolved in distillate water) and potassium persulfate (2.45 mM, dissolved in distillate water) in a ratio volume of 1:1. Then, the mixture was incubated in the dark room at room temperature for 16 h. Fresh ABTS•+ was diluted with ethanol absolute to an absorbance of 0.7 ± 0.02 at 750 nm using an iMark microplate absorbance reader (BioRad, California, USA). For the antioxidant assay, 20 μl of sample was mixed with 180 μl of blue-green fresh ABTS•+ in each flat bottom 96-well microplate. The plate was shaken for 10 s at medium speed. Then, after 5 min incubation in the dark room, the absorbance was measured at 750 nm using an iMark microplate absorbance reader (BioRad, California, USA) (Khatua et al., 2017). Trolox was used as standard ranging from 0.05 to 0.8 mmol/L. Each corresponding solvent was used as a blank. The procedures were performed in triplicate. Antioxidant activity is reported as the equivalent of millimoles of Trolox equivalent per g of dry weight of the sample (mmol TE/g DW).
2.8 Optimization of PIL extraction using NADES
2.8.1 Single-factor experiment
This experiment extracted 0.5 g of PIL using 10 ml of selected NADES solvent (ChCl-U). The single-factor experiment was performed by changing one of the variables while fixing the other two. The design of the study is present in Table S1. In this experiment, the TPC is used to evaluate the design. The procedures were performed in triplicate.
2.8.2 RSM study
According to single-factor experiment results, the RSM (using Box-Behnken Design, BBD) was used to investigate the possible interaction of selected extraction variable. A 0.5 g of PIL was extracted using 10 ml of ChCl-U NADES. The design of RSM study is presented in Table S2. The response of the extraction condition included TPC, TFC, and antioxidant activity (DPPH, ABTS, RP, and FRAP methods). This study was analyzed by Design-Expert 7. The procedures were performed in triplicate.
2.8.3 Verification of optimal condition
The optimal conditions from the RSM study were verified on the NADES extract of PIL obtained from ChCl-U (1:3) containing 26 % water. Extraction was performed at 52 °C using an ultrasonic bath 40 kHz for 15 min. To verify these optimal conditions, the test parameters determined were TPC, TFC, and antioxidant activity (DPPH, RP, ABTS, and FRAP methods). Each corresponding solvent was used as a blank. The procedures were performed in triplicate.
2.9 Fourier transform infrared spectroscopy (FTIR) analysis
FTIR analysis was performed on individual components of NADES and synthesized ChCl-U NADES, which was used in a single-factor study. This analysis purposed to observe the characteristics of the molecular interactions due to the influence of variations in molar ratios and variations in water addition. FTIR spectrometer (Agilent Cary 630 FTIR, California, USA) was used in real-time. At room temperature, the liquid samples (0.5 ml) were scanned from 4000 to 500 cm−1.
2.10 Scanning electron microscope (SEM) analysis
The microstructure of PIL dry powder was examined by SEM both before and after extraction by ChCl-U, 50%-ethanol, and methanol (Zeiss EVO-MA 10, Oberkochen, Germany). In brief, a small portion of the sample was deposited on carbon tape and placed on the sample disc. Under vacuum, the sample was coated with a thin layer of Pt (5 nm). Then, the samples were directly observed under SEM at different magnifications (500 × and 3000 × ). Finally, data were recorded.
2.11 UPLC-QToF-MS/MS analysis
Chemical identification of the extracts (ChCl-U, EE, and ME) was carried out using the UPLC-QToF-MS/MS system. Briefly, the separation of components in the extracts was carried out by liquid chromatography using ACQUITY UPLC® H-Class system (Waters, USA). The separation occurred in a high-strength silica (HSS) UPLC column from ACQUITY UPLC® HSS C18 (1.8 μm, 2.1 × 100 mm) (Waters, USA). The temperature is 50 °C (column) and 25 °C (room). The mobile phase consisted of water and 5 mM ammonium formic (A), acetonitrile, and 0.05 % formic acid (B). All extracts were each diluted 10 × with HPLC grade methanol. The extract solution was filtered through a 0.22 μm syringe filter. The sample injection volume was 5 μl, the flow rate was 0.2 ml/min (step gradient), and the total running time was 23 min. The UPLC output system is connected to a two-generation quadrupole time-of-flight mass spectrometer Xevo G2-S QToF (Waters, USA) via the Electrospray Ionization (ESI) interface and was operated in the positive ion detection mode. Data acquisition and analysis were processed with Masslynx version 4.1 software.
2.12 Statistical analysis
All data in this study are presented as the mean (±standard deviation, SD) and were analyzed using one-way analysis of variance (ANOVA) (significant level p < 0.05). The correlation of TPC and TFC to antioxidant activity was analyzed by Pearson's test (significant level p < 0.05).
3 Results
3.1 Selection of the best NADES solvent for extraction of phenolics and flavonoids
Previously, it was reported that the phenolic extraction of PIL was well carried out using 50%-ethanol with UAE (Kongkiatpaiboon et al., 2018). In this study, extraction of polyphenols (phenolics and flavonoids) from PIL was carried out using 17 types of NADES with a water addition in NADES of 30 % (v/v), including ChCl-, glucose-, amine-, alcohol- and acid-based NADES. The determination of TPC was carried out using gallic acid as standard. The gallic acid calibration curve obtained by line equation is y = 0.0046x + 0.0116 (R2 = 0.999). Meanwhile, the determination of TFC was carried out using quercetin as a standard. The line equation of the quercetin calibration curve is obtained y = 0.0032x + 0.0123 (R2 = 0.998). The TPC and TFC values of the NADES extracts from PIL compared to EE and ME can be seen in Fig. 1A and Fig. 1B, respectively. Based on these data, it is known that the PIL extract from Glyc-LA (1:5) gives the highest TPC value (56.691 ± 3.597mgGAE/g DW), followed by ChCl-U (1:2) (42.713 ± 0.123 mgGAE/g DW) and Gly-U (1:1) (37.496 ± 1.845 mgGAE/g DW). Meanwhile, the Gly-U extract (1:1) had the highest TFC value (17.856 ± 0.088 mgQE/g DW), followed by Glyc-Gly (2:5) (15.106 ± 0.530 mgQE/g DW) and ChCl-U (1:2) (14.169 ± 0.088 mgQE/g DW). The 50%-ethanol solvent can extract phenolic better than methanol. In contrast, methanol was able to extract flavonoids better than 50%-ethanol solvent. These NADES solvents provide better TPC and TFC values than 50%-ethanol and methanol solvents.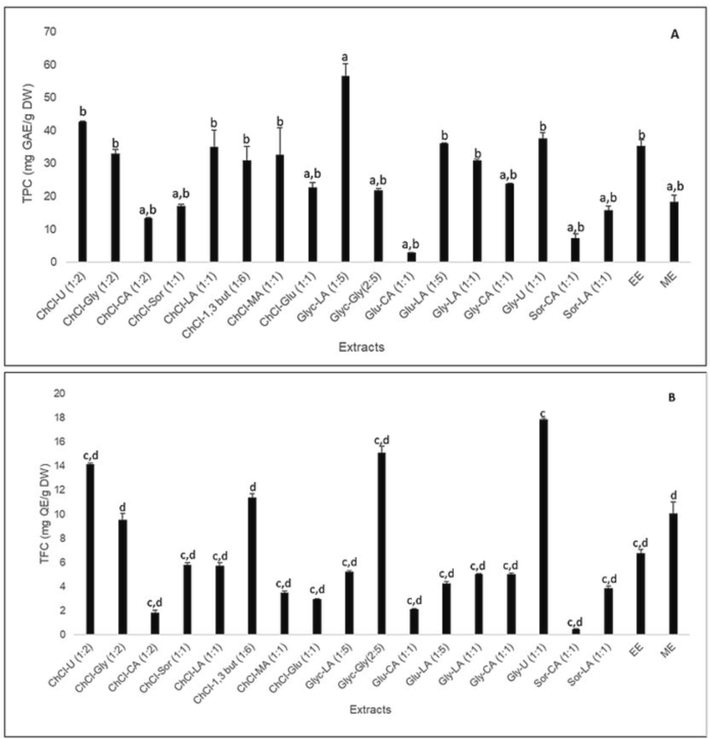
TPC (A) and TFC (B) of PIL extracts by different solvents. a)means p < 0.05 compared with EE; b)means p < 0.05 compared with Glyc-LA (1:5); c)means p < 0.05 compared with ME; d)means p < 0.05 compared with Gly-U (1:1).
The ability of the solvent to extract plant metabolites is affected by its polarity. The viscosity and pH of the NADES greatly affect the extraction results of antioxidant polyphenols (Wu et al., 2021). This study also measured the viscosity and pH of each NADES solvent (Table S3). As a result, acidic-based NADES has a low pH value (<2), while amine-based NADES has a high pH value (>8). NADES with high viscosity values (such as ChCl-CA, Gly-CA, ChCl-Glu, and ChCl-Sor) have a low ability to extract polyphenols (both phenolic and flavonoids), while ChCl-U (1:2) with low viscosity value (7.90 mPa.s) gives good extraction results. Although Glyc-LA (1:5) is good for extracting PIL phenolics, this solvent is poor for extracting PIL flavonoids. Meanwhile, in this study, the extract from Gly-U (1:1) was found to be unstable because the extract experienced a significant colour change (from brown to brown-black) on the 2nd day of storage at a temperature of 4–8 °C. This study also found that Glyc-Gly (2:5) formed solids again at the bottom of the bottle after 7 days. Based on this results, ChCl-U (1:2) is an ideal type of NADES for extracting phenolics and flavonoids from PIL. Thus, ChCl-U was the NADES used to optimize the extraction conditions in the single-factor experiment and RSM studies for polyphenolic extraction and antioxidant activity. Furthermore, we did not continue Glyc-LA (1:5), Gly-U (1:1), and Glyc-Gly (2:5) in the subsequent analysis.
3.2 Single-factor experiments using ChCl-U
It is known that phenolic is an important component as an antioxidant (Dai & Mumper, 2010). Thus, TFC is used as a response to assess design in single-factor experimental studies. In this study, the variables tested are the extraction temperature (°C), the molar ratio, and the water addition in NADES (%). We used an ultrasonic bath with a fixed frequency of 40 kHz and power of 110 W (which cannot be varied) as an extraction instrument. Thus, we did not test the frequency and power variables as single factors. The results of the single-factor experiment in Fig. 2 show that a change in one of the test variables can affect the TPC.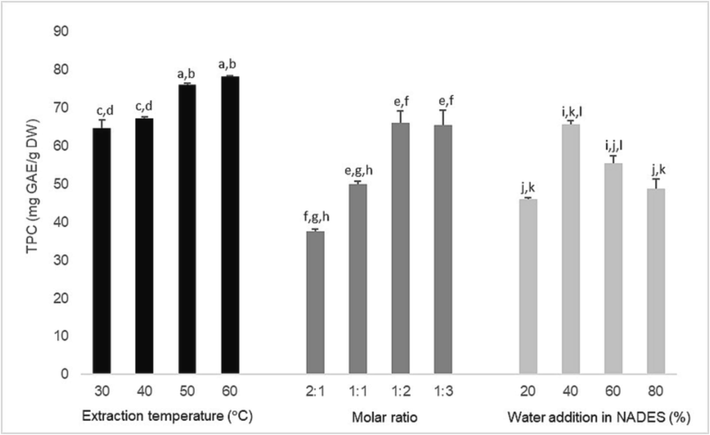
Effect of selected variable (extraction temperature, molar ratio, and water addition in NADES) on TPC with single-factor experimental design.
UAE is an extraction technique that uses ultrasonic vibrations. In some cases, increasing the extraction temperature can increase the phenolic recovery with this technique (Medina-Torres et al., 2017). Based on Fig. 2, the higher the extraction temperature, the higher the TPC content of the ChCl-U extract (1:2) from PIL. According to Rente et al. (2021), when extraction occurs at high temperatures, the viscosity and surface tension of NADES will decrease. It causes an increase in the desorption and dissolution of the extracted compounds in the NADES. However, in certain cases, too high temperatures can also affect the hydrogen bonding in NADES (Rente et al., 2021) or even the phenolic structure to be extracted from the plant matrix (Bonacci et al., 2020). In some ultrasonic instruments, the temperature setting inside is also limited to 60 °C, as used in this study. Thus, the extraction temperature range for further RSM studies is 30, 45, and 60 °C.
In terms of molar ratio, the higher ratio molar of urea than ChCl in choline chloride-based NADES, the higher the phenolic extraction ability from PIL. This study found that ChCl-U with a molar ratio of 2:1 could form solid again within 2 days. So, this ratio molar is not used for further study. In addition, we also tested the molar ratio of 1:4, the result is that the mixture turns into an even solid form within 6 h. Thus, the molar ratios of ChCl-U used for the RSM study are 1:1, 1:2, and 1:3.
The high viscosity of NADES is one of its weaknesses as a solvent for extracting natural compounds. Therefore, adding water to the NADES component fixes this problem (Dai et al., 2013). Based on Fig. 2, the variation of water addition in ChCl-U also plays a role in the TPC yield. The higher the percentage of water added in ChCl-U, the better the ability of ChCl-U to extract phenolic from PIL. However, adding too much water (>40 % up to 80 %, v/v) to ChCl-U further reduced the effectiveness of ChCl-U in extracting phenolic from PIL. Thus, percentage water addition of 80 % is not used for further analysis. The excess amount of water can affect the hydrogen bonding in ChCl-U, affecting its phenolic extraction ability (Dai et al., 2015). For the RSM study, the range of water addition in the NADES was 20, 40, and 60 %.
3.3 RSM experiments using ChCl-U
The results of the RSM study on the optimization of ChCl-U for phenolic and flavonoid extraction and their antioxidant activity can be seen in Table S4. Based on the ANOVA analysis on Design Expert (Table S5), in all models (for TPC, TFC and antioxidant activity tested), the p-value (prob > F) at lack of fit was greater than 0.05 which indicates that the inaccuracy of the model is not significant, so the suggested model can be continued. The correlation coefficient (R2) is relatively high for TPC, TFC, DPPH, FRAP, ABTS, and RP. It means there is a good fit between the experimental and the predicted values. In the model for TPC, only variable A (molar ratio) has a significant effect on the phenolic yield (prob > F = 0.0068, less than 0.05). In the model for TFC and FRAP, all variables A, B, and C (molar ratio, temperature, and water addition in NADES) have a significant effect on the acquisition of flavonoids and antioxidant activity (prob > F less than 0.05). In the model for DPPH and RP, only variable B (extraction temperature) has a significant effect on antioxidant activity (prob > F less than 0.05). In the model for ABTS, variables B (extraction temperature) and C (water addition) have a significant effect on antioxidant activity (prob > F less than 0.05).
The linear equations of each polynomial model appropriate for TPC, TFC, and antioxidant activity in this study are presented in Eq.1–6.
In this study, linearity and correlation analyses were also carried out from TPC, TFC, and respective antioxidant activity data using the DPPH, FRAP, ABTS, and RP methods. TPC*DPPH, TFC*DPPH, TPC*RP, and TFC*RP data were normally distributed (sig. > 0.05) and had a linearity relationship (sig. > 0.05) so that they could be continued in the Pearson correlation test. Meanwhile, TPC*FRAP, TFC*FRAP, and TFC*ABTS had no linearity relationship (sig. < 0.05), so they were not continued in the correlation test. Based on the results of the Pearson correlation test, TFC*DPPH (r = 0.539, sig. = 0.038), TPC*RP (r = 0.543, sig. = 0.036), and TFC*RP (r = 0.654, sig. = 0.008) have a positive correlation. Thus, the higher the levels of phenolics and flavonoids, the higher the antioxidant activity in reduction.
Measurement of antioxidant capacity can be done through chemical or cellular-based assays (Xu et al., 2017). Chemical-based assays are commonly used in the evaluation of antioxidants in foods and medicinal plants through two mechanisms of action, namely single electron transfer (SET) and hydrogen atom transfer (HAT) (Sadeer et al., 2020). This study studied the SET mechanism through the ABTS, FRAP, and RP methods. Meanwhile, the DPPH method studies the HAT mechanism (Shivakumar & Kumar, 2018). The DPPH and ABTS methods describe the ability of antioxidants to reduce radicals (DPPH• and ABTS•+), while FRAP and RP describe the ability of antioxidants to transfer electrons to reduce metal ions (Xu et al., 2017). This study showed a positive correlation was shown in the relationship between TPC*RP and TFC*RP. The RP method is based on the ability of antioxidants to form colour complexes with potassium ferricyanide, trichloroacetic acid, and ferric chloride (Alam et al., 2013). Antioxidants convert Fe3+-ferricyanide complexes to ferrous (Fe2+) form. The Prussian blue complex was produced by adding FeCl3. In this assay, the test solution’s yellow colour turns green or blue depending on the antioxidant's reducing potency. A higher absorbance suggests a greater ferric-reducing capability (Gulcin, 2020).
The 3-D surface form of the interaction of each parameter (TPC, TFC, and antioxidant activity) to its response is presented in Fig. S1 and Fig. S2. Although several forms of 3D graphics show sub-optimal responses (consideration of time efficiency, procedures, and environmental impacts), graphical models can still be used to extract polyphenol antioxidants. Based on the results of the RSM study, a ratio of 1:3, a temperature of 51.64 °C and a water addition of 26.29 % were the recommended best conditions for extracting polyphenol antioxidants from PIL using ChCl-U. Thus, to verify the optimum extraction conditions for the next study, will be carried out on ChCl-U with a molar ratio of 1:3, extraction temperature of 52 °C and water addition in ChCl-U of 26 %.
3.4 Comparison of the NADES-UAE and alcohol-UAE
The RSM confirmation results from ChCl-U studies compared with conventional organic solvents (50%-ethanol and methanol) are presented in Table 2. Based on these results, it was found that the experimental results of ChCl-U based NADES were quite consistent with the predicted value, although not all parameters were successful, such as in TFC and ABTS assay. In comparison, extracts from organic solvents (EE and ME) were measured under optimal extraction conditions (extraction temperature 52 °C). As a result, the ChCl-U extract significantly contains TPC and TFC and has higher antioxidant activity than the extracts from these organic solvents (ChCl-U extract > EE > ME). Note: ChCl-U = choline chloride-Urea; UAE = ultrasonic-assisted extraction; EE = 50%-ethanol extract; ME = methanol extract; PIL = P. indica leaves; a)means p < 0.05 compared with ChCl-U; b)means p < 0.05 compared with EE.
Responses
TPC (mgGAE/g DW)
TFC (mg QE/g DW)
DPPH (μmol QE/g DW)
RP (μmol TE/g DW)
ABTS (μmol TE/g DW)
FRAP (μmol TE/g DW)
ChCl-U based UAE (pred. value)
48.775
41.863
123.861
194.843
261.237
198.147
ChCl-U based UAE (exp. value)
71.380 ± 1.907b
9.713 ± 0.243b
124.942 ± 4.510
233.207 ± 2.431b
203.418 ± 0.078b
225.595 ± 3.865b
EE
61.190 ± 4.084a
7.486 ± 0.187a
122.941 ± 0.619
169.619 ± 6.370a
181.774 ± 1.513
141.208 ± 1.646a
ME
22.964 ± 3.184a,b
6.343 ± 1.030a
52.129 ± 2.255a,b
67.261 ± 5.860a,b
75.541 ± 5.645a,b
72.671 ± 5.963a,b
3.5 FTIR analysis of synthesized ChCl-U NADES
NADES consists of HBA and HBD via hydrogen bonds. Fig. 3 shows the FTIR spectra of synthesized ChCl-U NADES in this study compared to individual ChCl and Urea. Characteristics of the presence of hydroxyl group (H − O) H-bonded alcohol is indicated by a sharp absorption in the range 3650–3200 cm−1 (Pavia et al., 2001). Pure ChCl in this study shows the presence of this group at 3216 cm−1. The specific C − N group (range of 900–980 cm−1) (Mulia et al., 2015) from ChCl is indicated by the absorption at 950 cm−1. The 1479 cm−1 shows CH2 bending absorption. Meanwhile, the characteristics of pure urea are indicated by signals at 3324 and 3427 cm−1 related to the presence of N − H groups (Pavia et al., 2001). A signal at 1587 cm−1 indicates the presence of the C = O group. In addition, the 1457 cm−1 signal indicated the presence of a stretching C − N group (Zepeda-vallejo & Morales-ram, 2022). The ChCl-U NADES spectra synthesized at signals 3400–3200 cm−1 bind to the stretching O − H and N − H groups. The wide band shows more hydrogen bonding interaction between ChCl-U (Su et al., 2018). The ChCl-U complex occurs through the N − H bond of urea with Cl of ChCl (Zepeda-vallejo & Morales-ram, 2022).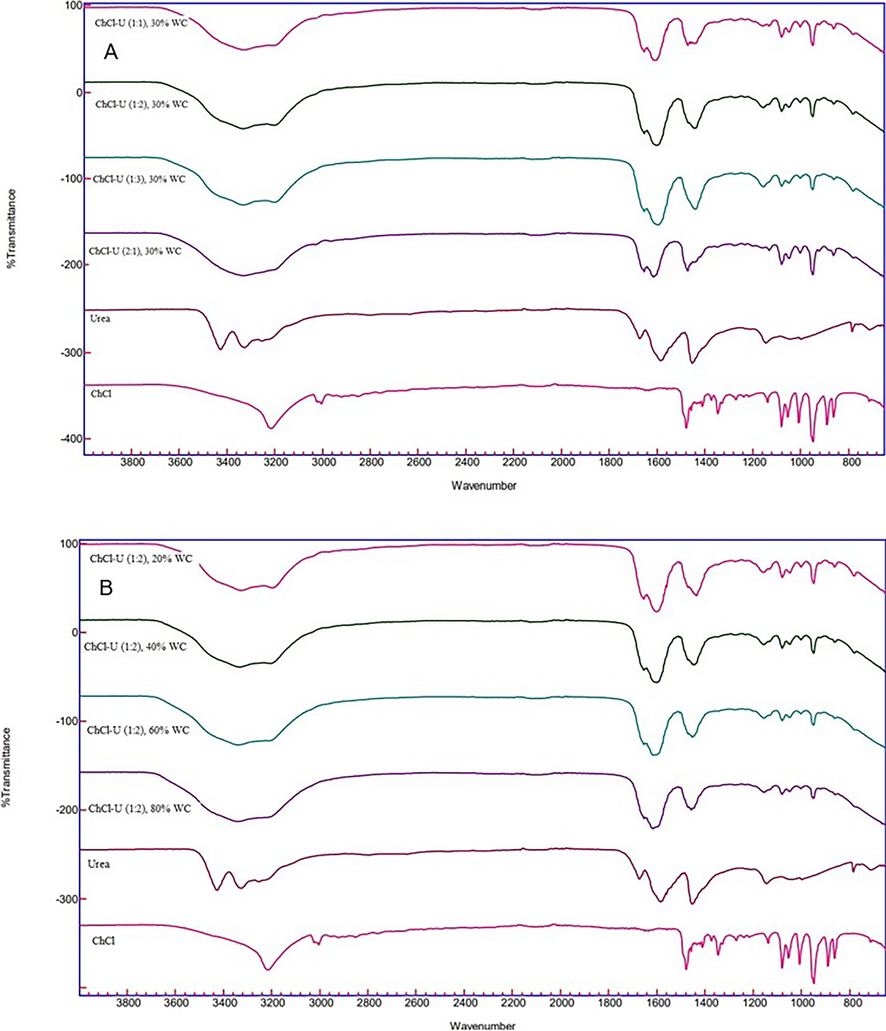
FTIR spectra of synthesized ChCl-U NADES in the variation of ratio molar (2:1, 1:1, 1:2, and 1:3) with water addition of 30% (w/w) (A) and in ratio molar of 1:2 with the variation of water addition (20, 40, 60, and 80%, w/w) (B) compared to pure ChCl and Urea.
Variation of the molar ratio in ChCl-U combined with 30 % water addition to reduce viscosity did not show disruptiion to the hydrogen bonds in the interaction of ChCl with urea. However, the intensity of the C = O stretching band (about 1587 cm−1) in the synthesized ChCl-U NADES with a molar ratio of 2:1 and 1:1 decreased (Fig. 3A). A decrease in O − H intensity also occurred in the synthesized ChCl-U at a molar ratio of 1:1.
Meanwhile, the effect of adding water (%, v/v) on synthesized ChCl-U NADES with a molar ratio of 1:2 did not show any disruption to the NADES structure. The greater the water addition (20–80 %) in NADES, the increase in the O − H stretching band, which is characterized by wider and deeper absorption peaks. However, the 80 % water addition in NADES reduced the intensity of the C = O stretching band (around 1550 cm−1) on the carbonyl group of ChCl-U. This is related to the statement that excess water can affect the hydrogen bonding in NADES and its ability to extract (Dai et al., 2015).
3.6 SEM analysis of PIL powders
The morphological characteristics of PIL leaves untreated and treated with ChCl-U (1:3), 50%-ethanol, and methanol using an ultrasonic bath were evaluated in this study. Based on Fig. 4., there has been a significant change in the surface structure of the leaf powder after being treated with ChCl-U (1:3) for 15 min using 40 kHz ultrasonic. The surface of the cells treated with ChCl-U (1:3) appeared to be more damaged than those treated with 50%-ethanol or methanol. According to Chemat et al. (2017), plant material extracted by ultrasonic will experience fragmentation, erosion, and detexturation (Chemat et al., 2017). Meanwhile, NADES is known to have a mechanism of action in the plant matrix extraction process, including, as a pre-treatment solvent, solvent, or cosolvent. NADES as a pre-treatment solvent, can help dissolve lignin components in biomass (Kalhor & Ghandi, 2019). As an extraction solvent, NADES can improve the extraction performance of metabolites from plant matrices (Hikmawanti et al., 2021). Thus, the NADES-UAE combination in this study is promising for further development extracting metabolites, especially phenolics, from PIL.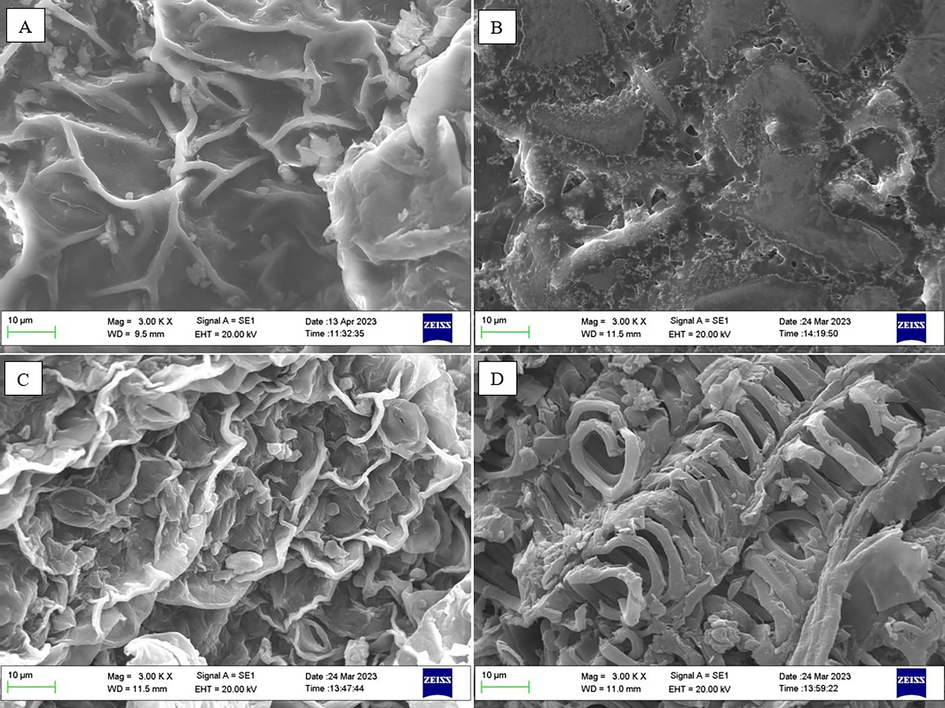
SEM image of PIL powder before (A) and after treated with ChCl-U (1:3) (B), 50%-ethanol (C), and methanol (D) for 15 min using ultrasonic bath 40 kHz at 3000 × magnifications.
3.7 LC-MS/MS analysis of PIL extracts
The chromatogram of the PIL extracts can be seen in Fig. 5. Each solvent has a different selectivity for the chemical components of PIL. The ChCl-U appears to have an extraction ability that tends to be selective towards the chemical components of PIL. According to Vongsak et al. (2018), the PIL polyphenol component that acts as an antioxidant is caffeoylquinic acid (CQAs) (Vongsak et al., 2018). Besides that, CQAs are also marker compounds that can be used to assess extract quality (Kongkiatpaiboon et al., 2018). CQAs are compounds consisting of a quinic acid core and one to four caffeic acid moieties. This compound has several types, namely mono-, di-, tri-, and tetra-caffeoylquinic acids. DCQA is a type of di-caffeoylquinic acid, where the quinic acid core is substituted with two caffeic acid moieties (viz., 3,4-DCQA, 3,5-DCQA, and 4,5-DCQA). TCQA is a type of tri-caffeoylquinic acid, where the quinic acid core is substituted with three caffeic acid moieties (viz., 1,3,5-TCQA and 3,4,5-TCQA) (Magaña et al., 2021). Thus, this study focuses on identifying qualitatively the presence of CQAs present in the three extracts. Based on Table 3, ChCl-U can selectively extract DCQA of PIL. Note: Rt = retention time; Ref = reference; EE = 50%-ethanol extract; ME = methanol extract; DCQA = Di-caffeoylquinic acid; TCQA = Tri-caffeoylquinic acid.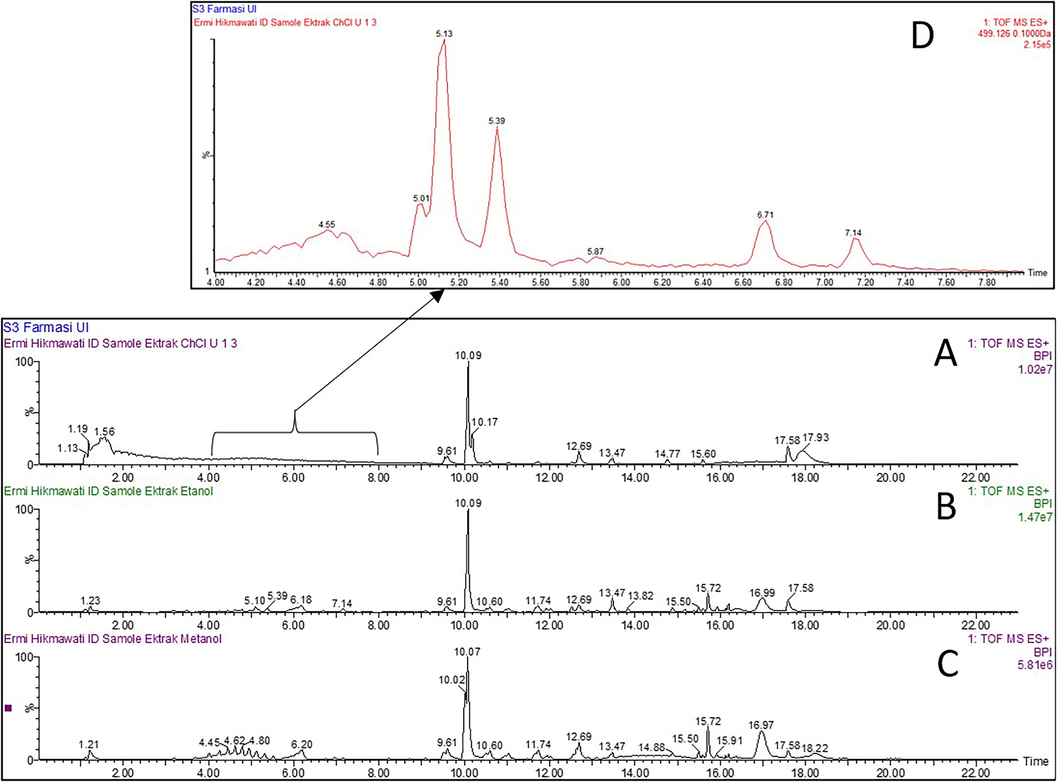
Chromatogram of UPLC-QToF analysis of PIL extracts. The chromatogram of ChCl-U (1:3) extract (A), EE (B), ME (C) and ChCl-U (1:3) extract at 4–8 min (D). Notes: EE = 50%-ethanol extract; ME = methanol extract.
Rt (min)
[M + H]+ (m/z)
MS-MS fragment ions (m/z)
Error (ppm)
Molecular formula
Mass exact
Tentative compounds
Ref.
ChCl-U Extract
5.127
517.1369
499.1258, 337.0920, 163.0398, 104.1078, 89.0388
4.4
C25H24O12
516.4
DCQA I
Santos et al., 2008
5.387
517.1375
499.1268, 337.0940, 163.0403, 135.0455, 104.1079, 89.0394
5.6
C25H24O12
516.4
DCQA II
Santos et al., 2008
EE
5.098
517.1339
499.1231, 337.0910, 163.0391, 135.0442, 125.9867, 89.0388
−1.4
C25H24O12
516.4
DCQA III
Santos et al., 2008
5.387
517.1359
499.1251, 337.0926, 303.0500, 163.0398, 135.0451
2.5
C25H24O12
516.4
DCQA IV
Santos et al., 2008
6.680
679.1663
517.1353, 499.1237, 453.3442, 182.9848, 163.0395
−1.8
C34H30O15
678.6
TCQA I
Ruan et al., 2019
7.145
679.1667
661.1559, 517.1357, 499.1238, 336.1244, 163.0396, 135.0443
0.6
C34H30O15
678.6
TCQA II
Ruan et al., 2019
ME
5.387
517.1359
499.1247, 337.0900, 163.0399, 125.9870
2.5
C25H24O12
516.4
DCQA V
Santos et al., 2008
6.709
679.1661
517.1343, 472.3177, 336.1239, 203.0525, 182.9850, 163.0391
−0.3
C34H30O15
678.6
TCQA III
Ruan et al., 2019
The 50%-ethanol extract can extract a more diverse range of DCQA and TCQA components than the methanol extract. Meanwhile, the ChCl-U extract selectively extracted the identified DCQA compounds at retention times of 5.127 min and 5.387 min. Meanwhile, The MS/MS [M + H]+ spectra showed the presence of a parent ion at m/z 517, identified as DCQA (Fig. 6.). It appears that fragment ions were identified at m/z 337 and 163. The ionic fragments at m/z 337 resulted from the elimination of the caffeic acid moiety, while the ion fragments at m/z 163 were due to the elimination of the quinic acid moiety (Santos et al., 2008).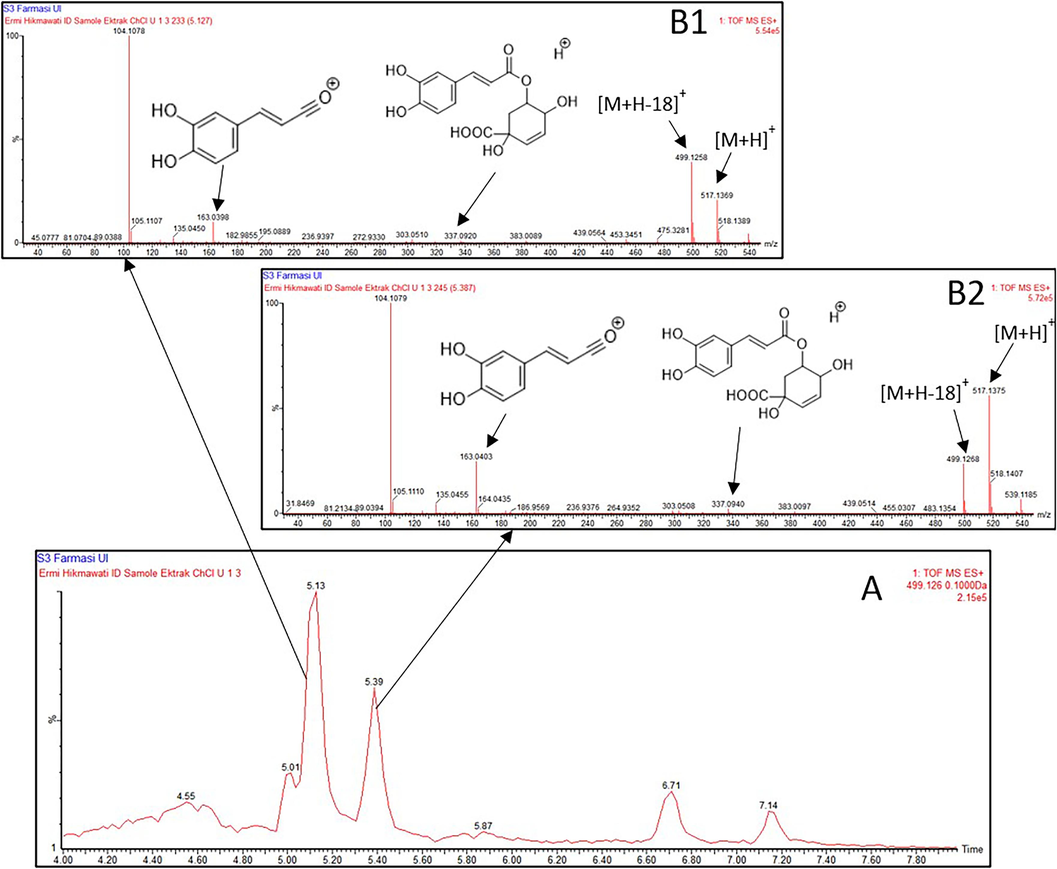
Identification of CQAs from two peaks in the ChCl-U (1:3) extract at Rt = 5.127 min and Rt = 5.387 min. The chromatogram of ChCl-U (1:3) extract at 4–8 min (A); Mass spectra showing the presence of DCQA in ChCl-U (1:3) extract at Rt = 5.127 min (B1) and Rt = 5.387 min (B2).
4 Discussion
Phenolics are one of the abundant chemical components of the plant kingdom. Polyphenols (including phenolic acids, flavonoids, lignans and stibelens) are a source of natural antioxidants (Xu et al., 2017). Extraction of phenolics (such as phenolic acids, flavonoids, anthocyanins, and stilbenes) from various plants with deep eutectic solvents (DES) has been reported (Ruesgas-Ramón et al., 2017). In general, extraction with DES or NADES is often carried out by microwave-assisted extraction (MAE), ultrasound-assisted extraction (UAE), and heating extraction (Ruesgas-Ramón et al., 2017). The UAE method can speed up this component’s extraction due to continuous mechanical stirring (Kaltsa et al., 2020). The UAE method is very applicable to use on a laboratory and even industrial scale for the extraction of natural product metabolites because of its efficiency, low cost, and simple procedure (Khadhraoui et al., 2021). The use of UAE in phenolic extraction can increase yield. In addition, it can reduce solvent consumption and extraction time. Phenolic extraction in a short time and low temperature can protect phenolic compounds from structure degradation (Alara et al., 2021). Previously, a study was conducted that the UAE method using 50%-ethanol for 15 min did give good phenolic yields from PIL compared to water, methanol, or absolute ethanol (Kongkiatpaiboon et al., 2018).
This present study showed that extracting polyphenolic antioxidant components from PIL exhibits favourable results with ChCl-U (1:3) NADES with 26 % (v/v) water addition. ChCl is an HBA which is commonly used in DES or NADES components. Meanwhile, for phenolic extraction, NADES is often made from a mixture of ChCl with malic acid (Duan et al., 2019), urea (Mansinhos et al., 2021), 1,3-butanediol (Peng et al., 2016), etc. NADES with the components ChCl (as a HBA) and urea (as an HBD) belong to the hydrophilic type (Chen et al., 2019). Through quantum mechanical molecular dynamics simulations studies, the hydrogen bond network between ChCl salt and urea shows good stability leading to high melting point and viscosity (Khadhraoui et al., 2021). In this study, the presence of water in the ChCl-U NADES component at a particular concentration can reduce the viscosity. In addition, FTIR analysis shows that the hydrogen bonds are not disrupted due to the presence of water in the ChCl-U NADES, but can affect the ability to extract metabolites. Urea acts as a nitrogen source in the NADES component (Liu et al., 2020). Water binds strongly to the urea C = O group and decreases H-bonding connections surrounding the urea NH2 groups, whereas choline plays only a tiny role in the intermolecular network (Di Pietro et al., 2021). Pal & Jadeja (2019) reported that ChCl-U (1:2) is a DES which can isolate three important flavonoid antioxidants, namely quercetin, kaempferol, and myricetin from onion peel (Pal & Jadeja, 2019). A study by Mansinhos et al. (2021) reported that ChCl-U (1:2) is a NADES solvent that can extract total phenolics, and its extracts show the best antioxidant activity against DPPH and ABTS (Mansinhos et al., 2021). Other findings reported that ChCl-U (1:2) with 5 % water content was able to extract solanesol (a terpenoid from tobacco leaves) (Hong et al., 2022). It shows that ChCl-U has good potential as a solvent for extracting plant metabolites.
Lastly, the selection of the appropriate NADES component with a certain molar ratio will provide an effective and efficient extraction capability of the intended target compound. In the future, ChCl-U as a solvent extraction of chemical components from PIL still needs to be studied regarding its profiling extracted metabolite, kinetics, stability, and toxicity as a source of antioxidants.
5 Conclusion
This study has obtained proper extraction conditions for antioxidant polyphenolic from PIL using UAE-based NADES. Based on the RSM study, the extraction conditions obtained were using ChCl-U NADES for 15 min with RSM: a molar ratio of 1:3, water addition 26 % (v/v), and temperature of extraction condition at 52 °C. Under these conditions, the extraction of total phenolics and flavonoids from PIL with antioxidant activity increased up to 1.2 folds and 3.1 folds compared with 50%-ethanol and methanol, respectively. This approach provides great promise for the efficiency and effectiveness of extracting phenolic antioxidants from PILs. Extraction with ChCl-U NADES can be used as an alternative to extraction with 50%-ethanol or methanol. However, further studies regarding the levels of marker or dominant compounds and the mechanism of action of the dominant components in extracts in vivo in experimental animals so that information on their toxicity still needs to be studied. These findings pave the way for the development of innovations in obtaining antioxidant polyphenolic components from PIL which have the potential to be applied in the production of food, medicine, nutraceuticals, and cosmetics.
Funding
This research and APC were funded by the Directorate of Research and Development, Universitas Indonesia [grant number: NKB-1170/UN2.RST/HKP.05.00/2022]; and the National Metabolomics Collaborative Research Center, Faculty of Pharmacy, Universitas Indonesia-National Research and Innovation Agency (BRIN) [grant number: 04/PKR/PPK-DFRI/2022; grant number: 151/PKS/WRIII-DISTP/UI/2022].
CRediT authorship contribution statement
Ni Putu Ermi Hikmawanti: Conceptualization, Methodology, Data curation, Formal analysis, Writing – original draft. Fadlina Chany Saputri: Conceptualization, Investigation, Visualization. Arry Yanuar: Conceptualization, Investigation, Supervision. Ibrahim Jantan: Supervision, Writing – review & editing. Ratih Asmana Ningrum: Supervision, Investigation, Project administration. Ario Betha Juanssilfero: Supervision, Investigation, Project administration. Abdul Mun'im: Conceptualization, Validation, Resources, Writing – review & editing, Funding acquisition.
Acknowledgments
The authors thank to Directorate of Research and Development, Universitas Indonesia and National Metabolomics Collaborative Research Center, Faculty of Pharmacy, Universitas Indonesia-National Research and Innovation Agency (BRIN) for supporting this research. We also thank to Azhar Darlan, M.Si. from Puslabfor Mabes POLRI for the UPLC-QToF-MS/MS analysis.
Declaration of competing interest
The authors declare that they have no known competing financial interests or personal relationships that could have appeared to influence the work reported in this paper.
References
- Preparation of medicinal plants: Basic extraction and fractionation procedures for experimental purposes. J. Pharm. Bioallied Sci.. 2020;12(1):1-10.
- [CrossRef] [Google Scholar]
- Review on in vivo and in vitro methods evaluation of antioxidant activity. Saudi Pharma. J.. 2013;21(2):143-152.
- [CrossRef] [Google Scholar]
- Extraction of phenolic compounds: A review. Curr. Res. Food Sci.. 2021;4(March):200-214.
- [CrossRef] [Google Scholar]
- Flavonoid content and antioxidant activity of vegetables from Indonesia. Food Chem.. 2010;121(4):1231-1235.
- [CrossRef] [Google Scholar]
- Polyphenols, carotenoids, and ascorbic acid in underutilized medicinal vegetables. J. Funct. Foods. 2012;4:339-347.
- [CrossRef] [Google Scholar]
- Identification of α-glucosidase inhibitors from the leaves of Pluchea indica (L.) Less., a traditional Indonesian herb: promotion of natural product use. Nat. Prod. Res.. 2014;28(17):1350-1353.
- [CrossRef] [Google Scholar]
- Intra-laboratory validation of microplate methods for total phenolic content and antioxidant activity on polyphenolic extracts, and comparison with conventional spectrophotometric methods. J. Sci. Food Agric.. 2015;95(1):204-209.
- [CrossRef] [Google Scholar]
- Natural deep eutectic solvent as extraction media for the main phenolic compounds from olive oil processing wastes. Antioxidants. 2020;9(6):1-14.
- [CrossRef] [Google Scholar]
- Ultrasound assisted extraction of food and natural products. Mechanisms, techniques, combinations, protocols and applications. A review. Ultrason. Sonochem.. 2017;34:540-560.
- [CrossRef] [Google Scholar]
- Green extraction of natural products. Origins, current status, and future challenges. Trends Anal. Chem.. 2019;118:248-263.
- [CrossRef] [Google Scholar]
- Review of alternative solvents for green extraction of food and natural products: Panorama, principles, applications and prospects. Molecules. 2019;24:3007.
- [CrossRef] [Google Scholar]
- Application of deep eutectic solvents in food analysis: A review. Molecules. 2019;24(24):1-12.
- [CrossRef] [Google Scholar]
- Simultaneous HPTLC quantification of three caffeoylquinic acids in Pluchea indica leaves and their commercial products in Thailand. Rev. Bras. 2019;29:177-181.
- [CrossRef] [Google Scholar]
- Plant phenolics: Extraction, analysis and their antioxidant and anticancer properties. Molecules. 2010;15:7313-7352.
- [CrossRef] [Google Scholar]
- Natural deep eutectic solvents as new potential media for green technology. Anal. Chim. Acta. 2013;766:61-68.
- [CrossRef] [Google Scholar]
- Tailoring properties of natural deep eutectic solvents with water to facilitate their applications. Food Chem.. 2015;187:14-19.
- [CrossRef] [Google Scholar]
- Antifungal activity of beluntas indian camphorweed (Pluchea indica) ethanol extract on Candida albicans in vitro using different solvent concentrations. Eur. J. Dent.. 2022;16(3):637-642.
- [CrossRef] [Google Scholar]
- In competition for water: Hydrated choline chloride: Urea vs choline acetate: Urea deep eutectic solvents. ACS Sustain. Chem. Eng.. 2021;9:12262-12273.
- [CrossRef] [Google Scholar]
- Green extraction of phenolic acids from Artemisia argyi leaves by tailor-made ternary deep eutectic solvents. Molecules. 2019;24:2842.
- [CrossRef] [Google Scholar]
- Choline chloride–lactic acid-based NADES as an extraction medium in a response surface methodology-optimized method for the extraction of phenolic compounds from hazelnut skin. Molecules. 2021;26(9):2652.
- [CrossRef] [Google Scholar]
- A green and integrated strategy for enhanced phenolic compounds extraction from mulberry (Morus alba L.) leaves by deep eutectic solvent. Microchem. J.. 2020;154:104598
- [CrossRef] [Google Scholar]
- Gómez-Urios, C., Viñas-Ospino, A., Puchades-Colera, P., Blesa, J., López-Malo, D., Frígola, A., & Esteve, M. J. (2023). Choline chloride-based natural deep eutectic solvents for the extraction and stability of phenolic compounds, ascorbic acid, and antioxidant capacity from Citrus sinensis peel. Lwt, 177(November 2022). Doi: 10.1016/j.lwt.2023.114595.
- Antioxidants and antioxidant methods: an updated overview. Arch. Toxicol.. 2020;94(3):651-715.
- [CrossRef] [Google Scholar]
- Hikmawanti, N. P. E., Ramadon, D., Jantan, I., & Mun’im, A. (2021). Natural Deep Eutectic Solvents (NADES): Phytochemical Extraction Performance Enhancer for Pharmaceutical and Nutraceutical Product Development. Plants, 10(2091). Doi: Doi: 10.3390/plants10102091.
- Natural deep eutectic solvent combined with ultrasonic enhancement: A green extraction strategy for solanesol in tobacco leaves. Ind. Crop. Prod.. 2022;187:115355
- [CrossRef] [Google Scholar]
- NMR-based metabolomics profiling for radical scavenging and anti-aging properties of selected herbs. Molecules. 2019;24:3208.
- [CrossRef] [Google Scholar]
- DPPH scavenging activities and phytochemical content of four asteraceae plants. Int. J. Pharmacogn. Phytochem. Res.. 2017;9(6):755-759.
- [CrossRef] [Google Scholar]
- Antiviral activity of Cananga odorata against hepatitis B virus. Kobe J. Med. Sci.. 2019;65(2):E71-E79.
- [Google Scholar]
- High-throughput methods to assess lipophilic and hydrophilic antioxidant capacity of food extracts in vitro. J. Agric. Food Chem.. 2008;56(10):3470-3477.
- [CrossRef] [Google Scholar]
- Deep eutectic solvents for pretreatment, extraction, and catalysis of biomass and food waste. Molecules. 2019;24(22)
- [CrossRef] [Google Scholar]
- A green extraction process for polyphenols from elderberry (Sambucus nigra) flowers using deep eutectic solvent and ultrasound-assisted pretreatment. Molecules. 2020;25(921):1-17.
- [CrossRef] [Google Scholar]
- Review of ultrasound combinations with hybrid and innovative techniques for extraction and processing of food and natural products. Ultrason. Sonochem.. 2021;76:105625
- [CrossRef] [Google Scholar]
- Simplified methods for microtiter based analysis of in vitro antioxidant activity. Asian J. Pharma.. 2017;11(2):S327-S335.
- [Google Scholar]
- Techniques for analysis of plant phenolic compounds. Molecules. 2013;18(2):2328-2375.
- [CrossRef] [Google Scholar]
- Optimization of extraction method and HPLC analysis of six caffeoylquinic acids in Pluchea indica leaves from different provenances in Thailand. Rev. Bras. 2018;28(2):145-150.
- [CrossRef] [Google Scholar]
- Synthesis of N-unsubstituted cyclic imides from anhydride with urea in deep eutectic solvent (DES) choline chloride/urea. Chem. Pap.. 2020;74(0123456789)
- [CrossRef] [Google Scholar]
- Caffeoylquinic acids: chemistry, biosynthesis, occurrence, analytical challenges, and bioactivity. Plant J.. 2021;107(5):1299-1319.
- [CrossRef] [Google Scholar]
- Ultrasonic-assisted extraction and natural deep eutectic solvents combination: A green strategy to improve the recovery of phenolic compounds from Lavandula pedunculata subsp. lusitanica (Chaytor) Franco. Antioxidants. 2021;10(582):1-21.
- [CrossRef] [Google Scholar]
- Ultrasound assisted extraction for the recovery of phenolic compounds from vegetable sources. Agronomy. 2017;7(47)
- [CrossRef] [Google Scholar]
- Ministry of Health Republic of Indonesia. (2017). Farmakope Herbal Indonesia II (Indonesian Herbal Pharmacopoeia II) (2nd ed.). Kementerian Kesehatan RI, Direktorat Jenderal Bina Kefarmasian dan Alat Kesehatan.
- Selected Natural Deep Eutectic Solvents for the Extraction of α -Mangostin from Mangosteen (Garcinia mangostana L.) Pericarp. International. J. Technol.. 2015;7(December):1211-1220.
- [CrossRef] [Google Scholar]
- Deep eutectic solvent-based extraction of polyphenolic antioxidants from onion (Allium cepa L.) peel. J. Sci. Food Agric.. 2019;99(4):1969-1979.
- [CrossRef] [Google Scholar]
- Optimization and kinetic study of ultrasound assisted deep eutectic solvent based extraction: A greener route for extraction of curcuminoids from Curcuma longa. Ultrason. Sonochem.. 2021;70(105267):1-10.
- [CrossRef] [Google Scholar]
- Pavia, D. L., Lampman, G. M., Kriz, G. S., & Vyvyan, J. R. (2001). Introduction to Spectroscopy (Fourth Edi). Brooks/Cole.
- Green extraction of five target phenolic acids from Lonicerae japonicae Flos with deep eutectic solvent. Sep. Purif. Technol.. 2016;157:249-257.
- [CrossRef] [Google Scholar]
- Anti-obesity and antioxidant activities of selected medicinal plants and phytochemical profiling of bioactive compounds. Int. J. Food Prop.. 2017;20(11):2616-2629.
- [CrossRef] [Google Scholar]
- The role of hydrogen bond donor on the extraction of phenolic compounds from natural matrices using deep eutectic systems. Molecules. 2021;26(8)
- [CrossRef] [Google Scholar]
- Medicinal plants used by the villagers of a Sundanese community in West Java, Indonesia. J. Ethnopharmacol.. 2008;115(1):72-81.
- [CrossRef] [Google Scholar]
- Comprehensive chemical profiling in the ethanol extract of Pluchea indica aerial parts by Liquid Chromatography/Mass Spectrometry analysis of its silica gel column chromatography fractions. Molecules. 2019;24:2784.
- [CrossRef] [Google Scholar]
- Application of Deep Eutectic Solvents (DES) for phenolic compounds extraction: Overview, challenges, and opportunities. J. Agric. Food Chem.. 2017;65(18):3591-3601.
- [CrossRef] [Google Scholar]
- The versatility of antioxidant assays in food science and safety—chemistry, applications, strengths, and limitations. Antioxidants. 2020;9(8):1-39.
- [CrossRef] [Google Scholar]
- HPLC-ESI-MS/MS analysis of oxidized di-caffeoylquinic acids generated by metalloporphyrin-catalyzed reactions. Quim. Nova. 2008;31(4):767-770.
- [CrossRef] [Google Scholar]
- Phytochemical screening, total flavonoid and total phenolic content and antioxidant activity of different parts of Caesalpinia bonduc (L.) Roxb. Pharmacogn. J.. 2018;10(1):123-127.
- [CrossRef] [Google Scholar]
- Critical review on the analytical mechanistic steps in the evaluation of antioxidant activity. Crit. Rev. Anal. Chem.. 2018;48(3):214-236.
- [CrossRef] [Google Scholar]
- Sirichaiwetchakoon, K., Lowe, G. M., Kupittayanant, S., Churproong, S., & Eumkeb, G. (2020). Pluchea indica (L.) Less. tea ameliorates hyperglycemia, dyslipidemia, and obesity in high fat diet-fed mice. Evidence-Based Complementary and Alternative Medicine, 2020. Doi: 10.1155/2020/8746137.
- Antioxidant and antibacterial activities of Indian marsh fleabane (Pluchea indica (L.) Less) Asia-Pac. J. Sci. Technol. (APST): KKU Res. J.. 2015;20(2):144-154.
- [CrossRef] [Google Scholar]
- Choline chloride-urea deep eutectic solvent enhanced removal of lead from mining area soil in the presence of oxalic acid. Ekoloji. 2018;27(106):563-569.
- [Google Scholar]
- Evaluation of ethnobotanical vegetables and herbs in Samut Songkram province. Procedia Eng.. 2012;32:160-165.
- [CrossRef] [Google Scholar]
- Nutrition, health benefits and applications of Pluchea indica (L.) Less leaves. Mahidol Univ. J. Pharm. Sci.. 2014;41(4):1-10.
- [Google Scholar]
- Phytochemical screening and extraction: A review. Int. Pharma. Sci.. 2011;1(1):98-106.
- [CrossRef] [Google Scholar]
- Vanda, H., Verpoorte, R., Klinkhamer, P. G. L., & Choi, Y. H. (2019). Natural Deep Eutectic Solvents: From Their Discovery to Their Applications. In D. J. Ramón & G. Guillena (Eds.), Deep Eutectic Solvents: Synthesis, Properties, and Applications (1st Ed, pp. 61–81). Wiley-VCH Verlag GmbH & Co. KGaA. Doi: 10.1002/9783527818488.ch4.
- Comparison of active constituents, antioxidant capacity, and α-glucosidase inhibition in Pluchea indica leaf extracts at different maturity stages. Food Biosci.. 2018;25:68-73.
- [CrossRef] [Google Scholar]
- Wardani, A. K., Mun’im, A., & Yanuar, A. (2018). Inhibition of HIV-1 reverse transcriptase of selected Indonesia medicinal plants and isolation of the inhibitor from Erythrina variegata L. Leaves. Journal of Young Pharmacists, 10(2), 169–172. Doi: 10.5530/jyp.2018.10.38.
- Widyawati, P. S. P. S. P. S., Wijaya, C. H. C. H., Hardjosworo, F. S., Sajuthi, D., HARDJOSWORO, P. S., & Sajuthi, D. (2013). Volatile Compounds of Pluchea indica Less and Ocimum basillicum Linn Essential Oil and Potency as Antioxidant. HAYATI Journal of Biosciences, 20(3), 117–126. Doi: 10.4308/hjb.20.3.117.
- World Health Organization. (2011). Quality control methods for herbal materials. World Health Organization.
- Eco-friendly and high-efficient extraction of natural antioxidants from Polygonum aviculare leaves using tailor-made deep eutectic solvents as extractants. Sep. Purif. Technol.. 2021;262:118339
- [CrossRef] [Google Scholar]
- Natural antioxidants in foods and medicinal plants: Extraction, assessment and resources. Int. J. Mol. Sci.. 2017;18(1):96.
- [CrossRef] [Google Scholar]
- Zepeda-vallejo, L. G., & Morales-ram, Á. D. J. (2022). Kinetics of Zn – C Battery Leaching with Choline Chloride / Urea Natural Deep Eutectic Solvents. Recycling, 7(86), 1–14. Doi: doi.org/10.3390/ recycling7060086.
Appendix A
Supplementary material
Supplementary data to this article can be found online at https://doi.org/10.1016/j.arabjc.2023.105537.
Appendix A
Supplementary material
The following are the Supplementary data to this article:Supplementary data 1
Supplementary data 1
Fig. S1. 3D-surface of TPC and TFC shows the interaction between variables with each response. Fig. S2. 3D-surface of antioxidant activity shows the interaction between variables with each response


