Translate this page into:
Integrating metabolic profile and network pharmacology to explore the chemical essence of Radix Ginseng Rubra for attenuating heart failure
⁎Corresponding authors at: Yinchuan Hospital of Traditional Chinese Medicine, Yinchuan 750001, China. wyjie41@163.com (Yinjie Wang), ycws_zyy@163.com (Zhilong Zhao)
-
Received: ,
Accepted: ,
This article was originally published by Elsevier and was migrated to Scientific Scholar after the change of Publisher.
Peer review under responsibility of King Saud University.
Abstract
Radix Ginseng Rubra (RGR), a well-known edible-medicinal herb, has been widely used to attenuate heart failure (HF). However, the active ingredients and mechanism of RGR for attenuating HF have not been illuminated. Thus, the metabolic profile in vivo of RGR was investigated by ultra-performance liquid chromatography quadrupole time-of-flight tandem mass spectrometry and further the compounds identified in serum and heart were employed to search for the potential active compounds and targets via network pharmacology and molecular docking. 41 chemical compounds were identified in RGR aqueous extract. 10 prototypes and 8 metabolites were identified or tentatively characterized in vivo. Additionally, two compounds with 51 corresponding targets had been speculated to improve HF, and the role of ginsenoside Rh4 (P8) in RGR for attenuating HF by interfering with MAP2K1 and SRC targets was verified by molecular docking. Therefore, the potential active ingredients and targets were expected to be the basis of RGR therapy for HF.
Keywords
Radix Ginseng Rubra
UPLC-Q-TOF-MS
Metabolism
In vivo
Network pharmacology
1 Introduction
Heart failure (HF) is one of the cardiovascular diseases with the characteristics of substantial incidence and morbidity, which is generally considered to be a reduced ability of the heart to pump or fill with blood. A few investigations have shown that the incidence of HF in 10 provinces of China is as high as 0.9 % (Wang, et al., 2021). It presented a serious threat to human health.
Radix Ginseng Rubra (RGR), which is a traditional edible-medicinal herb belonging to Panax ginseng C.A. Mey, is popular in East Asian countries. It is obtained from steaming fresh ginseng at 95–100 °C for 2–3 h, followed by artificial drying and then sun-drying (Zhang, et al., 2012). RGR possesses multiple bioactivities, such as anti-inflammatory, anti-diabetes, anticancer, antioxidant, and antidiabetic (Jeon, et al., 2020). In previous studies, multiple metabolites, mostly deglycosylated, have been identified during the in vitro biotransformation of RGR by human intestinal microflora (Mi, et al., 2023;Wang, et al., 2014). But there are few metabolic studies in vivo of RGR. In traditional Chinese medicine (TCM) theory, it is supposed to have a “warm effect”, and could be commonly used in the attenuation of HF owing to the cardioprotective effect (Zhang, et al., 2012;Lim, et al., 2014). Modern clinical has indicated that RGR has been employed in the prescription of common medicines, such as Shenmai injection and Shenfu injection, improving HF.
Ginsenoside, considered to be the primary constituents responsible for pharmacological activities of RGR (Shin, et al., 2015), could be divided into dammarane-type, oleanane-type and cardiac glycosides according to its structures. Meanwhile, ginsenosides have several changes under different processing conditions of ginseng (Yi, et al., 2010). Through dehydration and steam treatments, new bioactive compounds unpresent in raw ginseng might come into being (Kim, et al., 2007;Xie, et al., 2012). In addition, the adverse effects should not be ignored, which are typically related to the dosage of ginseng medicines. The adverse effects of RGR are less than those of ginseng and ginseng leaves (Ran, et al., 2022). This ability to transform the constitution of the ginsenosides provides a unique opportunity to reach the potential of RGR to attenuate HF (Zhao, et al., 2020). So far, even though chemical compounds of RGR have been studied by a few researchers or organizations, the metabolic profile and its mechanism for HF mitigation have not been fully elucidated.
To explain the potential pharmacological effect of RGR on HF, we made use of ultra-performance liquid chromatography coupled with quadrupole time-of-flight tandem mass spectrometry (UPLC-Q-TOF-MS) to identify the chemical compounds of the RGR aqueous extract and its metabolic profile in vivo. The structural information of ginsenoside Rg1 was used to verify the metabolic profile of RGR. Thereinto, the compounds in serum and heart were subjected to network pharmacological analysis and molecular docking to obtain the potential effective compounds and corresponding targets.
Taken together, the potential active ingredients and targets of RGR on HF mitigation were investigated simultaneously. This study explored the essence and was expected to lay a basis for further investigation on potentially effective ingredients and pharmacological research on RGR for attenuating HF. The whole workflow is shown in Fig. 1.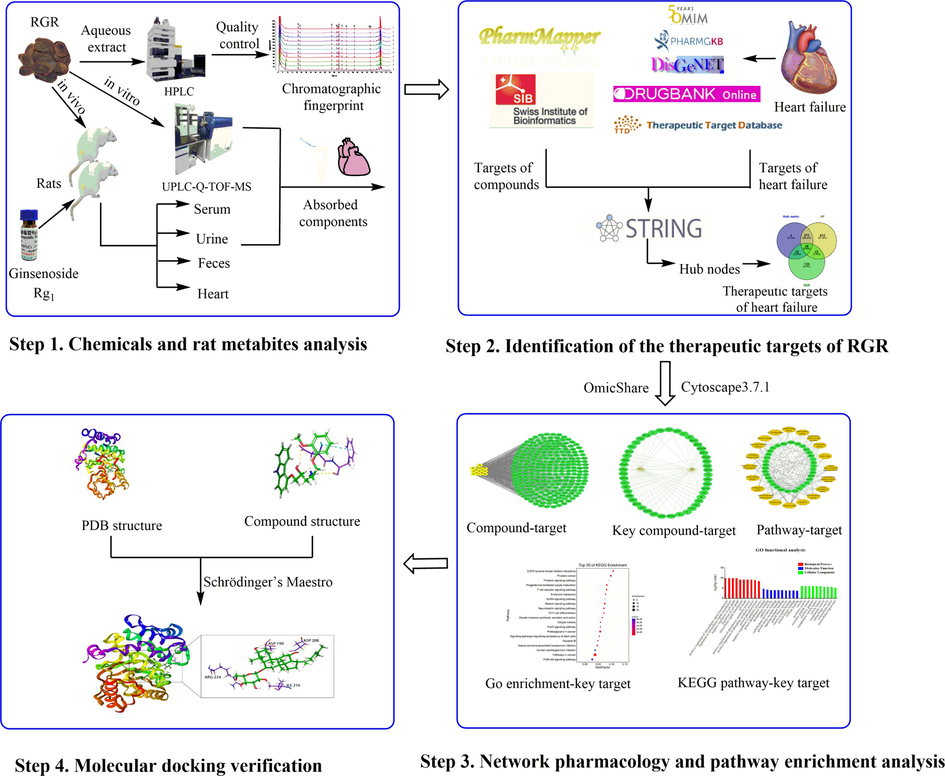
The workflow of the analysis procedure.
2 Materials and methods
2.1 Materials and reagents
RGR (LOP200401) was produced by Jilin and was purchased from Guangdong Provincial Hospital of Traditional Chinese Medicine. All reference standards of ginsenoside Rg1 (RP200320), ginsenoside Re (RP200421), ginsenoside Rf (RP200403), ginsenoside Rh1 (RP200723), ginsenoside Rb1 (RP181018), ginsenoside Rc (RP180109), ginsenoside Rb2 (RP200813), ginsenoside Rg3 (RP200528), ginsenoside Rg5 (RP200917), ginsenoside Ro (RP200521) and notoginsenoside R1 (RP210202) were purchased from the Chengdu RefMedic Biotech Co., Ltd. (Chengdu, China). The purity of these reference standards was higher than 98 % as determined by HPLC. Methanol (I1077207008) and acetonitrile (JB079830), the chromatographic grade for MS analysis were obtained from Merck (Darmstadt, Germany). Formic acid (H158A), HPLC grade was purchased from Honeywell Trading Co., Ltd. (Shanghai, China). Waters OASIS HLB solid-phase extraction (SPE) cartridges (6 cc/200 mg, 30 μm) were obtained from Waters Technologies Co., Ltd. (Milford, America). Super purified water was obtained from Guangzhou Watsons Food & Beverage Co., Ltd. (Guangzhou, China). A total of 10 batches of RGR were all collected from different manufacturers, and all were authenticated by associate professor Haibo Huang (Guangzhou University of Chinese Medicine, Guangzhou, China), as shown in Table S1.
2.2 Sample preparation
2.2.1 RGR sample solutions and reference solutions
For HPLC fingerprint analysis, RGR slices (100 g) were accurately weighed and extracted with 1000 mL water before immersing for 30 min and then decocting for 1 h. After being filtered through cheesecloth (150 mesh), the residue was decocted for 40 min with 800 mL water. The filtrate was mixed and concentrated properly, and then diluted quantitatively with water to 500 mL to obtain the standard decoction (0.2 g/mL). Five milliliters of the standard decoction were placed in a 25 mL volumetric flask, methanol was added to the mark and the solution was shaken well. The extract was centrifuged at 12,000 rpm. for 5 min and then filtered through a nylon syringe filter (0.22 μm) for HPLC analysis.
Each reference standard was accurately weighed, dissolved in methanol, and used to generate stock standard solutions. They were then mixed and diluted with methanol to obtain reference standard mixture solution at an appropriate concentration as follows: ginsenoside Rg1 (0.2 mg/mL), ginsenoside Re (0.2 mg/mL), ginsenoside Rf (0.15 mg/mL), ginsenoside Rh1 (0.1 mg/mL), ginsenoside Rb1 (0.15 mg/mL), ginsenoside Rc (0.1 mg/mL), and ginsenoside Rb2 (0.1 mg/mL).
2.2.2 Preparation of RGR aqueous extract
For animal administration, RGR slices (100 g) were accurately weighed and extracted with 1000 mL water for immersion for 30 min and then decocting for 1 h. After being filtered through cheesecloth, the residue was decocted for 1 h with 800 mL water. The filtrate was then mixed and concentrated to 250 mL. The RGR aqueous extract with a crude drug concentration of 0.4 g/mL was obtained.
2.3 Animals and drug administration
The animal protocols were approved by the Guide for the Care and Use of Guangzhou University of Chinese Medicine, China (Ethical Review NO. 20191210007). All experimental procedures were approved by the Laboratories Institutional Animal Care and Use of Laboratory Animals (Guangzhou University of Chinese Medicine).
Eighteen male rats (220–250 g) were purchased from the experimental animal center of Guangzhou University of Chinese Medicine (Guangzhou, China) and were bred in the Class SPF Experimental Animal Room of Guangzhou University of Chinese Medicine for a week. The eighteen rats were randomized into three groups (n = 6): the blank group, the RGR aqueous extract group and the ginsenoside Rg1 group. Rats in the RGR aqueous extract and ginsenoside Rg1 groups were subjected to oral administration for three consecutive days, and rats in the blank group ingested only water. RGR aqueous extract was given to rats intragastrically at a dosage of 4 g/kg twice a day. Rats ingested ginsenoside Rg1 at 0.1 g/kg.
2.4 Biological sample collection and pretreatment
2.4.1 Serum samples
Blood samples were collected from the orbital venous plexus into tubes at 0.25, 0.5, 1, 2, and 4 h after administration on the third day and then separated by centrifugation at 4000 rpm for 10 min to obtain serum samples. The pooled blood sample (2 mL) was mixed, and added by a 4-fold volume of methanol to precipitate protein, followed by vortexing for 1 min and centrifuging at 14,000 rpm for 10 min to obtain the supernatant. Then, the supernatant was dried by a vacuum centrifugal concentrator in AL vent mode at 30 °C. The residues were reconstituted with 200 μL 50 % acetonitrile, vortexed for 1 min and centrifuged at 14,000 rpm for 10 min. Finally, 2 μL supernatant was injected into the UPLC-Q-TOF-MS system for analysis.
2.4.2 Urine samples
The urine samples were collected during 0–12 h and 12–24 h after administration on the third day. The pooled urine sample (6 mL) was mixed and centrifuged at 4000 rpm for 10 min. Then, the supernatant was added to pretreated SPE columns, washed once with pure water which was discarded then. Then, 0.1 % formic acid in methanol solution was used for elution and all the eluent were eventually collected. Subsequently, the supernatant was dried. The residues were reconstituted with 200 μL 50 % acetonitrile, vortexed for 1 min and centrifuged at 14,000 rpm for 10 min. Finally, 2 μL supernatant was injected into the UPLC-Q-TOF-MS system for analysis.
2.4.3 Feces samples
The feces samples were collected during 0–12 h and 12–24 h after administration. All feces samples from the two periods were mixed, dried and ground into powder. Feces samples (1.0 g) were added to 10 mL methanol and were ultrasonicated for 30 min at 500 W (40 kHz), followed by centrifugation at 14,000 rpm for 10 min. Subsequently, the supernatant was dried. The residues were reconstituted with 200 μL 50 % acetonitrile, vortexed for 1 min and centrifuged at 14,000 rpm for 10 min. Finally, 2 μL supernatant was injected into the UPLC-Q-TOF-MS system for analysis.
2.4.4 Heart samples
Rats were sacrificed after administration for 4 h, and then the heart samples were harvested and washed with normal saline. The heart samples (0.1 g) were homogenized in 1 mL normal saline in an ice bath. The homogenate was transferred into a new tube and centrifuged at 12,000 rpm for 10 min at 4 °C. Then, a 4-fold volume of methanol was added to the supernatant solution obtained to precipitate protein, followed by vortexing for 1 min and centrifuging at 14,000 rpm for 10 min. The supernatant solution was dried. The residues were reconstituted with 200 μL 50 % acetonitrile, vortexed for 1 min and centrifuged at 14,000 rpm for 10 min. Finally, 2 μL supernatant was injected into the UPLC-Q-TOF-MS system for analysis.
2.5 Instrument and chromatographic conditions
2.5.1 HPLC analysis
HPLC analysis was performed on an LC-20AT HPLC system equipped with an SPD-M20A PDA detector (Nexera, Japan). Chromatographic separation was conducted on an Agilent-Zorbax-SB C18 column (4.6 mm × 250 mm, 5 μm, Agilent Technologies) with a column temperature of 25 °C. The mobile phase consisted of acetonitrile (eluent A) and water with 0.1 % formic acid (eluent B) using a gradient elution mode of 81 % B at 0–35.0 min, 81–71 % B at 35.0–55.0 min, 71 % B at 55.0–70.0 min, and 71–60 % B at 70.0–100.0 min. The flow rate was 1.0 mL/min and the injection volume was 10 μL. For fingerprint analysis, the detection wavelength was set at 203 nm.
2.5.2 UPLC-Q-TOF-MS analysis
For UPLC-Q-TOF-MS analysis, all samples were analyzed on an AB Sciex 5600 Triple-TOFTM mass spectrometer (AB Sciex, CA, USA) coupled with a Shimadzu UPLC LC-30AD system (Kyoto, Japan) and controlled with Analyst® TF 1.7 software (AB Sciex). The chromatographic separation was achieved on a Hypersil GOLD aQ C18 column (Thermo, USA; 2.1 mm × 100 mm, 1.9 μm) at a temperature of 25 °C. The mobile phases consisted of acetonitrile (A) and water (B), both including 0.1 % aqueous formic acid (v/v). The solvent was delivered at a flow rate of 0.4 mL/min by using a gradient elution was as follows: 95 % B from 0.0 to 1.0 min, 95–90 % B from 1.0 to 2.0 min, 90–85 % B from 2.0 to 4.0 min, 85–80 % B from 4.0 to 6.0 min, 80–75 % B from 6.0 to 8.0 min,75–65 % B from 8.0 to 15.0 min, 65–55 % B from 15.0 to 20.0 min, 55–5 % B from 20.0 to 24.0 min, 5–0 % B from 24.0 to 25.0 min, 0 % B from 25.0 to 26.0 min. The UPLC system was coupled to a quadrupole-orthogonal time-of-flight (Q-TOF) tandem mass spectrometer equipped with electrospray ionization (ESI), acquiring UPLC-Q-TOF-MS spectra in the dynamic background subtraction mode by running in negative ion mode. In addition, the automated calibration delivery system could acquire precise mass measurements. The operating parameters were as follows: Capillary voltage of 5.5 kV (ESI+) or −4.5 kV (ESI-); source temperature of 550 °C; declustering potential of 100/−100 V. The atomizing gas is nitrogen, with 55 psi for nebulizer gas, 35 psi for curtain gas, and 55 psi for heater gas. For the information dependent acquisition (IDA) experiments, the collision energies were set at −45/45 eV, and the collision energy spread was set at 10/15 eV. TOF-MS spectra were obtained from 100 to 2000 Da.
2.6 Fingerprint analysis of RGR
2.6.1 Method validation of HPLC fingerprint analysis
The precision of the HPLC fingerprint method was determined by analyzing the replicated extraction solution of the same sample six times within a day. The sample stability was determined with one sample on one consecutive day (0, 4, 8, 16, 24, and 48 h). The analytical method was validated by the repeatability, stability and accuracy of the S4 sample. During this period, the solution was stored at room temperature.
2.6.2 Establishment of HPLC fingerprints and similarity analysis
To establish the representative chromatographic fingerprint, 10 batches of RGR samples were analyzed under HPLC. The similarities between the entire chromatographic profiles of 10 batches of RGR and the reference chromatographic fingerprint were determined by the Similarity Evaluation System (SES) for Chromatographic Fingerprint of Traditional Chinese Medicine 2012 Version (Chinese Pharmacopoeia Commission, Beijing, China).
2.7 UPLC-Q-TOF-MS data processing
The first step was to establish a self-building chemical compound library using literature such as PubMed, CNKI, Chemspider, SciFinder, etc., in which each chemical was marked with a number. The library contained information about compound name, molecular formula, structure and accurate molecular mass.
The second step was to summarize the fragmentation characteristics and retention time behaviour of available reference standards to identify the unknown compounds in RGR aqueous extract. The molecular formula and the identification number of chemicals from the self-built library were imported into Peakview 1.5 during data processing. We gained the most rational molecular formula and mass accuracy within a reasonable degree of measurement error (ppm < 5). In the meantime, fragmentation information achieved was utilized to identify compounds. The ClogP values of compounds, which were calculated by ChemDraw Ultra 19.0, were introduced to distinguish between structural isomers. Generally, compounds with larger values of ClogP exhibited longer retention times in reversed-phase liquid chromatography systems.
The third step was to analyze the biological samples from rats drugged with RGR aqueous extract administered to rats by LC-MS in negative ion mode to characterize the prototypes and metabolites. Using MetabolitePilot 2.0.4, prototypes, metabolites along with their metabolic pathways were determined thoroughly.
2.8 Establishment of the network pharmacology analysis
2.8.1 Collection of targets for identified compounds and HF
The compounds identified in serum and heart were imported into Swiss Target Prediction (https://www.swisstargetprediction.ch/) and PharmMapper (https://www.lilab-ecust.cn/pharmmapper/) in the format of 2D.sdf and mol2 respectively to obtain the compound-related targets (Zhou, et al., 2019;Daina, et al., 2019). Then, the corresponding human target gene name and Uniprot ID were obtained by entering the collected targets into the Uniprot database (https://www.uniprot.org/) by limiting “homo sapiens”. The targets associated with HF were collected from the available databases such as Therapeutic Target Database (https://db.idrblab.net/ttd/), Online Mendelian Inheritance in Man (https://omim.org/) and so on.
2.8.2 Screening of the key compounds and targets of RGR and HF
The targets of identified compounds and HF were supplemented by the STRING (https://string-db.org/) to construct the protein–protein interaction network which was related to “homo sapiens”, with the measurement set at 0.700 of the high confidence score (Zhu, et al., 2019). Subsequently, the topological characteristics, “Betweenness Centrality (BC)”, “Closeness Centrality (CC)” and “Degree Centrality (DC)”, were calculated by using a network analyzer of Cytoscape 3.7.1 plug-in. Then, we searched for the hub node and calculated the intersection between compound targets and HF targets through Venny 2.1.0. Specifically, the targets collective of the compounds and HF were chosen as direct targets, and the indirect targets were acquired by the collective of compounds and hub nodes other than the direct targets. The integration of the direct targets and indirect targets was identified as the potential profile of targets. Through Cytoscape 3.7.1, the network of the potential targets and corresponding compounds was used to analyze DC, CC and BC. The key compounds and key targets were identified by the above analysis.
2.8.3 GO and KEGG pathway enrichment analysis for key targets
The key targets of compounds were analyzed through Gene Ontology (GO) function enrichment and Kyoto Encyclopedia of Genes and Genomes (KEGG) pathway enrichment from OmicShare (https://www.omicshare.com/), and the P-value < 0.5 of them were selected (Qi, et al., 2019). The GO database, including biological process (BP), molecular function (MF) and cellular component (CC), could be devoted to the analysis of potential biological action of mechanism. The KEGG database was used to identify the candidate targets and biological functions. Ranking the P-value in descending order of GO and KEGG pathways, a GO secondary classification histogram was drawn for the top 10 enrichment terms in the BP, MF and CC by using GraphPad Prism 7 and the top 20 of these KEGG pathways were visualized in a bubble diagram through OmicShare.
2.9 Molecular docking verification
In our study, targets associated with more pathways (pathways entries ≥ 5) were considered the major targets for HF mitigation. Thus, the major targets were used to do docking with key compounds. The crystal structures of the major targets were derived from the RCSB protein data bank (PDB) database (http://www.rcsb.org/) (Zhu and Hou, 2020). Through protein preparation wizard with a default setting of Schrödinger’s Maestro (version 11.9), the crystal structures were optimized, such as assigning bond order, adding hydrogen and removing water (Sajon, 2019). All the default settings were used as implemented (Dutta, et al., 2017). Then, Mol2 formats of key compounds were imported into the “Ligand Preparation” to prepare the ligands of the compounds. And then, through the standard preparation (SP) module of the ligand docking, the ligand of the key compounds and PDB proteins, which were optimized for ligand preparation, were docked to compute the prepared protein and ligand interactions under default settings, get the docking score. The docking scoring could be used to evaluate the binding affinity of the ligand to the protein receptor, the lower the absolute value, the better the binding affinity. Finally, based on the root mean square deviation (RMSD) of the superposition module, values below 2 Å as molecular docking are reliable (Zhu and Hou, 2020).
3 Results
3.1 The results of validation of the fingerprint method
The HPLC fingerprint analysis method was validated in terms of precision, repeatability and stability. Peak 3 (ginsenoside Rf) at a retention time of 57.30 min was set as the reference peak, and the relative retention times (RRTs) and relative peak areas (RPAs) were calculated. Using RRTs and RPAs, the fingerprint method was verified. The precision, repeatability and stability of the relative standard deviations (RSDs) of RRTs and RPAs of common peaks were less than 0.06 % and 2.89 %, 0.04 % and 2.09 %, and 0.05 % and 2.31 %, respectively. The above results demonstrated that the samples were stable during the experiment and that the fingerprint analysis method of RGR is reliable and reproducible.
3.2 Similarity analysis
HPLC fingerprints of RGR samples showed that the peaks of the 10 investigated chemical markers displayed satisfactory resolution, as shown in Fig. S1a. Seven components were identified as ginsenoside Rg1 (peak 1, 21.54 min), ginsenoside Re (peak 2, 23.47 min), ginsenoside Rf (peak 3, 57.30 min), ginsenoside Rh1 (peak 4, 62.57 min), ginsenoside Rb1 (peak 6, 65.06 min), ginsenoside Rc (peak 7, 68.29 min) and ginsenoside Rb2 (peak 8, 72.16 min) by comparing their retention times and UV spectra with those of standard compounds, and they are listed in Fig. S1b. The other three common fingerprint peaks were unknown.
SES was used to calculate the similarities between batches of sample chromatograms and the reference chromatogram. The similarity of the ten batches of samples was calculated based on the “vector cosine” method, which was built in the same software using all the detected peaks (Liu, et al., 2005). Common peaks with a peak area of more than 0.01 % of the total peak area were obtained in the matching. Peak 3 (ginsenoside Rf) at a retention time of 57.30 min in the chromatogram was set as the reference peak. The chromatogram of S4 (Fig. S2) was set as the reference chromatogram. A total fingerprint chromatogram of 10 batches and a reference fingerprint chromatogram were produced, which are shown in Fig. S2. Ten common peaks (Peaks 1–10) and a reference chromatogram (R) were aligned and marked. The correlation coefficients of all samples are shown in Table S2. The similarity values were above 0.913 (except S6 (0.898)), which suggested that the RGR from the different sources had no significant influence overall.
3.3 Identification and characterization of chemical components in the RGR aqueous extract
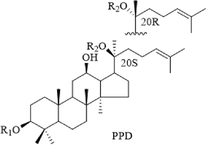
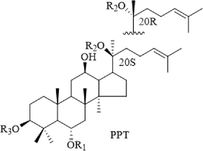
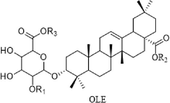
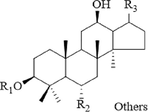
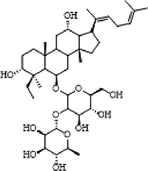
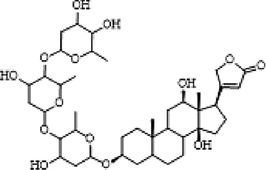
The chemical components of the RGR aqueous extract were identified and characterized by UPLC-Q-TOF-MS. The extracted ion chromatograms (EICs) of the reference standards and chemical compounds in negative ion mode by UPLC-Q-TOF-MS were displayed in Fig. S3 and Fig. S4, respectively. Meanwhile, the detailed MS data information and MS cleavage pathways of each reference standard in negative ion mode were shown in Table S3 and Fig. S5, respectively. Then, MS/MS mass spectrum scanning was performed to obtain the fragment ion information of the compounds, and the target compounds were identified by reference standards and the related literature. The MS information of these chemical compounds was shown in Table S4, with two MS spectrum of typical compounds displayed in Fig. 2. Finally, the structures of dammarane-type, oleanane-type and cardiac glycosides were shown in Fig. 3. A total of 41 chemical compounds were identified in the negative ion mode by the reference standards and literature data. Among them, 36 compounds originated from dammarane-type compounds, which were 14 protopanaxadiol type (PPD), 12 protopanaxatriol type (PPT) and 10 derivatives of PPD and PPT. A total of 4 compounds originated from the oleanane type and 1 compound originated from cardiac glycoside. The structural formulas of recognized compounds were shown in Table 1. Most of them were the dammarane-type. Note: *Meant that the compounds are identified with reference standard. Xyl, Glu, Rha, Arap, Araf meant xylose, glucose, rhamnose, arabopyranose and arabinofuranose, respectively.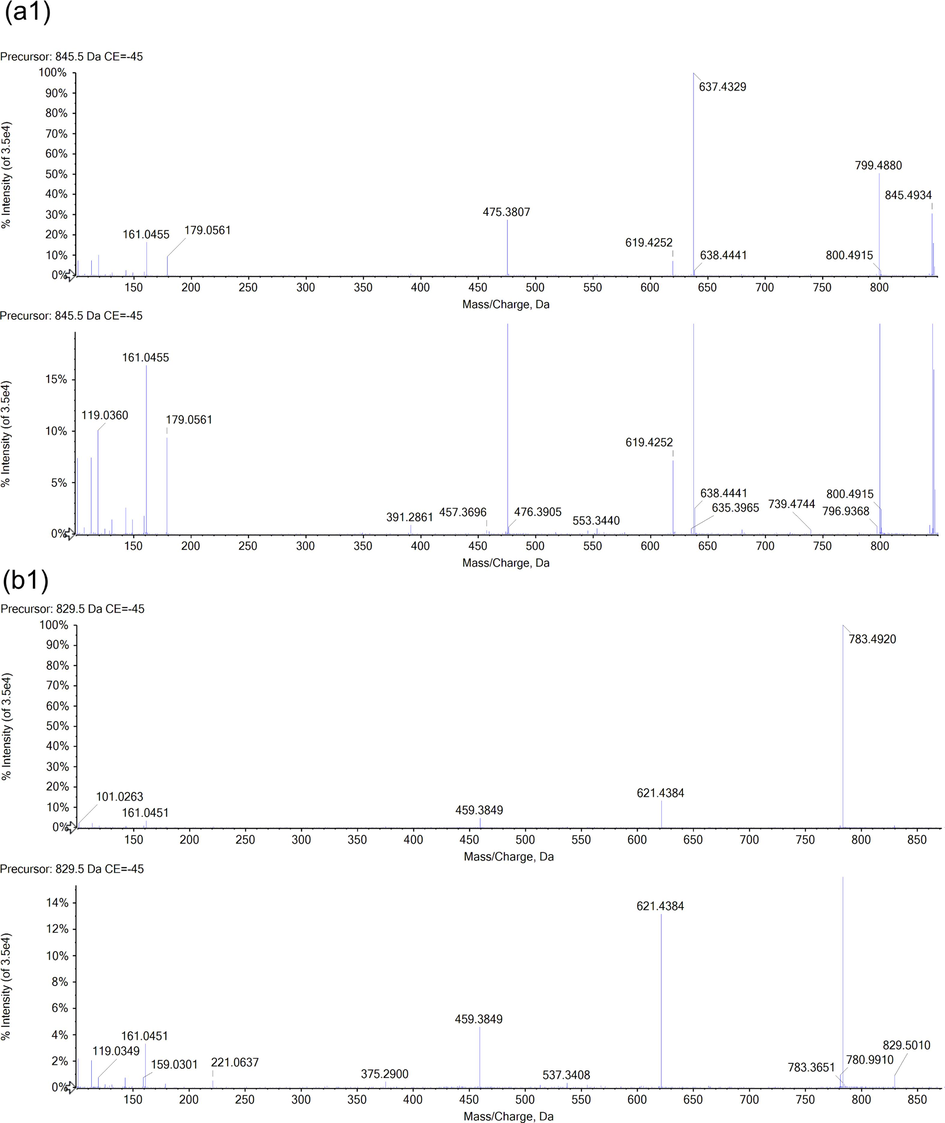
The MS spectrum of typical chemical compounds in negative ion mode. (a) ginsenoside Rg1, (b) ginsenoside Rg3.

Structures of dammarane-type (a), oleanane-type (b) and cardiac glycosides (c).
Structural formula
No.
RT (min)
Identification
R1
R2
R3
11
13.14
Ginsenoside Mc
H
Glu (6–1) Araf
/
16*
14.74
Ginsenoside Rb1
Glu (2–1) Glu
Glu (6–1) Glu
/
18
15.10
Ginsenoside Malonyl-Rb1
Glu (2–1) Glu-6-malonyl
Glu (2–6) Glu
/
19*
15.27
Ginsenoside Rb2
Glu (2–1) Glu
Glu (6–1) Arap
/
20
15.31
Ginsenoside Ra2
Glu (2–1) Glu
Glu (6–1) Araf (2–1) Xyl
/
22*
15.82
Ginsenoside Rc
Glu (2–1) Glu
Glu (6–1) Araf
/
23
16.02
Ginsenoside Rb3
Glu (2–1) Glu
Glu (6–1) Xyl
/
25
17.05
Ginsenoside Rs1
Glu (2–1) Glu-6-acetyl
Glu (6–1) Xyl
/
27
17.27
Malonyl-Ginsenoside Rd
Glu (2–1) Glu-6-malonyl
Glu
/
28
17.51
Ginsenoside Rs2
Glu (2–1) Glu-6-acetyl
Glu (6–1) Araf
/
30
18.78
NotoGinsenoside Fe
Glu
Glu (6–1) Xyl
/
35*
21.44
Ginsenoside Rg3
Glu (2–1) Glu
H
/
36
21.61
20-(R)-ginsenoside Rg3
Glu (2–1) Glu
H
/
37
22.29
Ginsenoside Rs3
Glu (2–1) Glu-6-acetyl
H
/
4
8.80
20-Ginsenoside Rf
Glu (2–1) Glu
Glu
H
5*
9.04
NotoGinsenoside R1
Glu (2–1) Xyl
Glu
H
6
9.29
Vinaginsenoside R4
H
Glu
Glu (2–1) Glu
7*
9.51
Ginsenoside Rg1
Glu
Glu
H
9*
9.58
Ginsenoside Re
Glu (2–1) Rha
Glu
H
10*
13.14
Ginsenoside Rf
Glu (2–1) Glu
H
H
12
13.81
Ginsenoside F5
H
Glu (6–1) Araf
H
13
14.40
20(R)-Notoginsenoside R2
Glu (2–1) Xyl
H
H
14
14.51
20(S)-Ginsenoside Rg2
Glu (2–1) Rha
H
H
15*
14.51
Ginsenoside Rh1
Glu
H
H
17
14.91
20(R)-Ginsenoside Rh1
Glu
H
H
8
9.51
Chikusetsusaponin IVa butyl ester
H
Glu
(CH2)3CH3
21*
15.62
Ginsenoside Ro
Glu
Glu
H
26
17.05
Chikusetsusaponin Iva
H
Glu
H
34
20.97
Zingibroside R1
Glu
H
H
1
6.81
Floralginsenoside Ka
H
OGlu

2
7.11
Ginsenoside Rh6
H
OH

3
8.44
Notoginsenoside R3
H
OGlu

24
16.91
23-O-methylginsenoside-Rg11
Glu (2–1) Glu
H

29
18.58
Ginsenoside R2
H
OGlu-acetyl (2–1) Xyl

32
19.69
Ginsenoside Rk3
H
OGlu

33
20.19
Ginsenoside Rh4
H
OGlu

38*
22.67
Ginsenoside Rg5
Glu (5–1) Glu
H

40
23.22
Ginsenoside Rs4
Glu (2–1) Glu-6-acetyl
H

41
23.80
Ginsenoside Rk2
Glu
H

31
8.44
Ginsenoside Rg4
/
/
/
39
22.71
Digoxin
/
/
/
3.3.1 Dammarane-type
Compounds 3, 4, 5, 6, 7, 9, 10, 12, 13, 14, 15 and 17 were characterized as PPT, while compounds 11, 16, 18, 19, 20, 22, 23, 25, 27, 28, 30, 35, 36 and 37 were characterized as PPD, and compounds 1, 2, 24, 29, 31, 32, 33, 38, 40 and 41 were characterized as their derivatives. Their fragment pathways had been well established in the prior literature (Zhang, et al., 2012).
The fragment ion at m/z 459 was considered the characteristic ion of PPD, and the fragment ion at m/z 475 was considered the characteristic ion of PPT. In addition, their characteristic fragment pathways involved loss of the group linked with C-20. We subsequently described the fragment behaviours of these chemical compounds.
Compounds 3 (RT = 8.44 min), 4 (RT = 8.80 min) and 6 (RT = 9.29 min) were three isomers that showed the same intense fragment ions at m/z 961.5457, 799.4950, 637.4408 and 475.7690 by the elimination of water (18 Da) and glucose (162 Da). Compounds 3, 4, and 6 were assigned based on ClogP values of 0.7451, 1.6351, and 1.6351 by ChemDraw 12.0 software. Therefore, the three compounds were immediately identified as notoginsenoside R3, 20-ginsenoside Rf and vinaginsenoside R4 based on the ClogP values and retention times.
Moreover, compounds 7 and 10 were determined to be ginsenoside Rg1 and ginsenoside Rf as shown in Fig. S5 (b1-b2) and Fig. S5 (d1-d2), respectively, compared with the reference standards. Compound 7 showed an adduct [M + COOH]- ion at m/z 845.4934 with fragment ions at m/z 637.4329 and 475.3807, which were consistent with those of ginsenoside Rg1. Compound 10 showed an adduct [M + COOH]- ion at m/z 845.4936 with fragment ions at m/z 637.4338 and 475.3792, which were consistent with those of ginsenoside Rf as well.
Compound 15 was identified as ginsenoside Rh1 with the reference standard shown in Fig. S5 (e1-e2). Similarly, compound 17 showed an adduct [M + COOH]-ion at m/z 683.4394 and an [M - H]- ion at m/z 637.4341 with fragment ions at m/z 475.3807 and 391.2838, which were consistent with the results of compound 15. Hence, compound 17 was also tentatively characterized as an isomer of ginsenoside Rh1.
Compound 19 was determined to be ginsenoside Rb2 with the reference standard shown in Fig. S5 (g1-g2), which exhibited the same fragment ions at m/z 1123.6009 ([M + COOH]-), 945.5514 ([M - H-Arap]-), 783.4944 ([M - H-Arap-Glu]-), 621.4369 ([M - H-Arap-2Glu]-) and 459.3848 ([M−H−Arap−3Glu]-). In addition, it was the isomer of compound 22, which was identified as ginsenoside Rc when compared with the reference standard shown in Fig. S5 (i1-i2). Compound 35 (RT = 21.44 min) presented an adduct [M + COOH]- ion at m/z 829.5010 and an [M - H]- ion at m/z 783.4920. Its typical fragment ion at m/z 459.3849 was produced by the loss of 2 Glu (162 Da). The fragment ion at m/z 621.4367 was produced by the loss of Glu (162 Da), and the fragment ion at m/z 375.2900 was produced by the loss of 2 Glu (162 Da) and C6H12 (84 Da). They were the same as the fragmentation rules of ginsenoside Rg3 by comparison with the reference standard shown in Fig. S5 (j1-j2). Therefore, compound 35 was identified as ginsenoside Rg3. Furthermore, the ClogP values of compounds 14, 35 and 36 were 3.6483, 5.184, and 5.184, respectively. Compounds 14 and 36 were the isomers of compound 35, which were characterized as 20(S)-ginsenoside Rg2 and 20-(R)-ginsenoside Rg3, respectively.
Compound 38 presented an adduct [M + COOH]- ion at m/z 811.4882 and a [M - H]- ion at m/z 765.4815. Its fragment ion at m/z 603.4275 was produced by the loss of a Glu (162 Da). Therefore, compound 38 was characterized as ginsenoside Rg5 compared with the reference standard shown in Fig. S5 (k1-k2). In addition, compound 31 (ClogP = 5.3813) was the isomer of compound 38 (ClogP = 6.2483), which was characterized as ginsenoside Rg4.
3.3.2 Oleanane-type compounds
A total of 4 oleanane-type compounds were identified by reference standards and the related literatures. The fragment ion at m/z 455 was considered the characteristic ion of the oleanane-type compounds. Here, we described the fragment behaviours of these chemical compounds using ginsenoside Ro as an example.
Compound 21 (RT = 15.62 min) presented an [M - H]-ion at m/z 955.4943. Its fragment ion at m/z 937.4903 was produced by the loss of H2O (18 Da), while the fragment ion at m/z 793.4435 was produced by the loss of Glu (162 Da). m/z 455.3557 was produced by the loss of two Glu (162 Da) and C6H8O6 (176 Da). Compound 21 was exactly identified as ginsenoside Ro with the reference standard shown in Fig. S5 (h1-h2) and the literature (Zhu, et al., 2019).
3.3.3 Cardiac glycoside
There was 1 cardiac glycoside compound identified in the related literature. Compound 39 (RT = 22.71 min) presented an adduct [M + COOH]- ion at m/z 825.2899 and an [M - H]-ion at m/z 779.4389. Its fragment ion at m/z 781.4435 was produced by the loss of H2O. This compound was identified as digoxin.
3.4 Identification of prototypes and metabolites of RGR aqueous extract in rat serum, urine, feces and heart
Based on retention time behaviours and fragmentation patterns, a total of 18 RGR-related xenobiotics including 11 (10 prototypes and 1 metabolite) in serum, 1 prototype in urine, 9 (2 prototypes and 7 metabolites) in feces and 5 prototypes in the heart were detected in rats. The EICs of both prototypes and metabolites after oral administration of RGR aqueous extract by UPLC-Q-TOF-MS in negative ion mode were displayed in Fig. 4 and Fig. 5, respectively. Detailed information on the UPLC-Q-TOF-MS data of prototypes and metabolites was presented in Table 2 and Table 3, respectively. Note: √ means that compounds could be detected in rat biological samples. S, U, F and H mean serum, urine, feces and heart, respectively. Note: √ means that compounds could have been detected in rat biological samples. S and F mean serum and feces, respectively.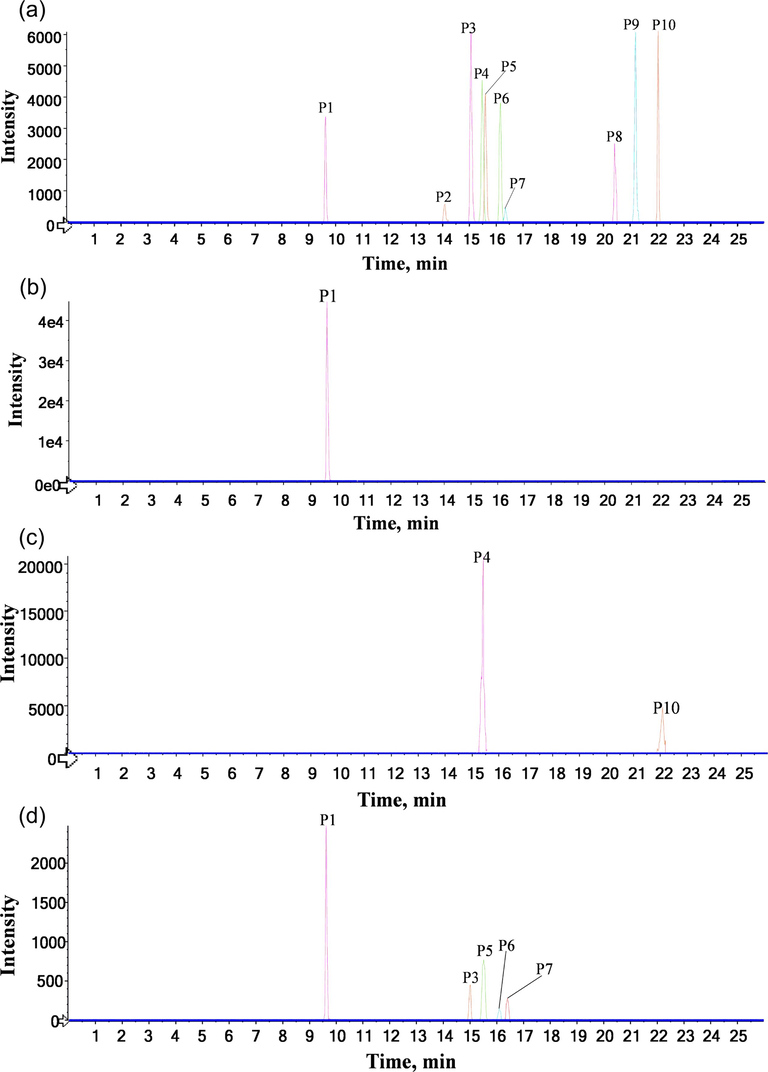
The EICs of prototypes of RGR aqueous extract by UPLC-Q-TOF-MS in negative ion mode. (a) serum, (b) urine, (c) feces, (d) heart.
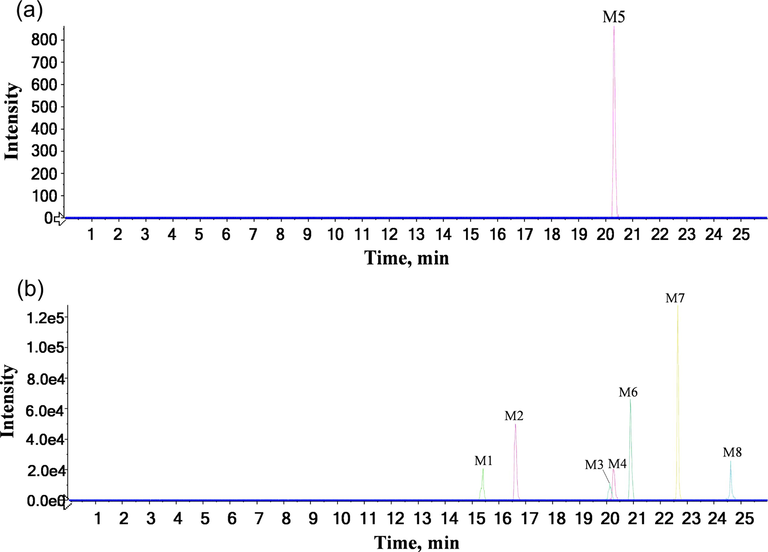
The EICs of metabolites of RGR aqueous extract by UPLC-Q-TOF-MS in negative ion mode. (a) serum, (b) feces.
No.
RT (min)
Selected ion
Formula
measured ion
Mass (Da)
Error (ppm)
Identification
MS/MS fragmentation
S
U
F
H
P1*
9.61
[M + COOH]-
C42H72O14
845.4910
800.4922
4.70
Ginsenoside Rg1
845.4997[M + COOH]-;
799.4930[M-H]-;
637.4352[M-H-Glu]-;
619.4354[M-H-Glu-H2O]-;
475.3818[M-H-2Glu]-
√
√
√
P2
14.05
[M + COOH]-
C41H70O13
815.4875
770.4816
7.5
20(R)-Notoginsenoside R2
815.4849[M + COOH]-;
769.4834[M-H]-;
637.4397[M-H-Araf]-;
619.4174[M-H-Araf-H2O]-;
475.3851[M-H-Araf-Glu]-;
391.2822[M-H-Araf-Glu-C6H12]-
√
P3*
15.04
[M + COOH]-
C54H92O23
1153.6038
1108.6029
3.27
Ginsenoside Rb1
1153.6138[M + COOH]-;
1107.6034[M-H]-;
945.5468[M-H-Glu]-;
783.4969[M-H-2Glu]-;
765.4967[M-H-2Glu-H2O]-;
621.4349[M-H-3Glu]-
√
√
P4*
15.4
[M + COOH]-
C36H62O9
638.4394
637.4318
−0.45
Ginsenoside Rh1
683.4396[M + COOH]-;
638.4346[M-H]-;
475.3804[M-H-Glu]-;
457.3705[M-H-Glu-H2O]-;
391.2859[M-H-Glu-C6H12]-
√
√
P5*
15.58
[M + COOH]-
C53H90O22
1123.5941
1078.5924
4.09
Ginsenoside Rb2
1077.5954[M-H]-;
945.5445[M-H-Arap]-;
915.5498[M-H-Glu]-;
783.4966[M-H-Arap-Glu]-;
621.4415[M-H-Arap-2Glu]-
√
√
P6*
16.13
[M + COOH]-
C53H90O22
1123.594
1078.5924
4.06
Ginsenoside Rc
1123.5941[M + COOH]-;
1077.5921[M-H]-;
945.5541[M-H-Araf]-;
915.5323[M-H-Glu]-;
783.4950[M-H-Araf-Glu]-;
765.4787[M-H-Araf-Glu-H2O]-;
621.4437[M-H-Araf-2Glu]-
√
√
P7
16.35
[M + COOH]-
C53H90O22
1123.5917
1078.5924
4.70
Ginsenoside Rb3
1123.5917[M + COOH]-;
1077.5929[M-H]-;
945.5477[M-H-Xyl]-;
915.5236[M-H-Glu]-;
783.5015[M-H-Xyl-Glu]-
√
√
P8
20.42
[M + COOH]-
C36H60O8
665.4307
620.4288
7.17
Ginsenoside Rh4
665.4366[M + COOH]-;
619.4289[M-H]-;
551.7670[M-H-C5H8]-
√
P9
21.17
[M−H]-
C42H66O14
793.4412
794.4453
5.30
Zingibroside R1
793.4482[M-H]-;
613.3727[M-H-Glu-H2O]-;
569.3936[M-H-Glu-H2O-COO]-;
453.3439[M-H-Glu-C6H10O6]-
√
P10*
22.01
[M + COOH]-
C42H72O13
829.5011
784.4973
0.75
Ginsenoside Rg3
829.4997[M + COOH]-;
783.4896[M-H]-;
621.4426[M-H-Glu]-;
459.3823[M-H-2Glu]-
√
√
No.
RT (min)
Selected ion
Formula
measured ion
Mass (Da)
Error (ppm)
Identification
MS/MS fragmentation
S
F
M1
15.40
[M−H]-
C36H62O9
637.4316
638.4388
−0.9
Ginsenoside Rg1-Glu
637.2699[M-H]-;
569.2896[M-H-C5H8]-;
517.2780[M-H-2H2O-C6H12]-;
407.2780[M-H-C5H8-Glu]-
√
M2
16.61
[M + COOH]-
C36H60O9
681.4210
636.4228
−1.3
Ginsenoside Rb1-4Glu + GluA
681.4254[M + COOH]-635.4192[M-H]-;
489.3605[M-H-C5H6O5]-; 457.3316[M-H-GluA-2H]-; 387.2903[M-H-GluA-2H-C5H10]-
√
M3
20.11
[M−H]-
C49H84O16
927.5650
928.5722
−4.0
Ginsenoside Rb2-Arap-2O + CH2
457.2566[M-H-2Glu-C6H10O4]-;
√
M4
20.25
[M + COOH]-
C36H60O8
665.4265
620.4283
−0.8
Ginsenoside Rg1-2Glu-2O + GluA
665.4289[M + COOH]-;
619.4263[M-H]-;
585.3292[M-H-2OH]-;
425.3468[M-H-C6H8O5-2H2O]-; 409.6514[M-H-C6H8O5-2H2O-O]-; 391.2977[M-H-C6H8O5-C5H8]-
√
M5
20.31
[M + COOH]-
C42H72O13
829.4944
784.4973
9.3
Ginsenoside Rb1-2Glu
829.5058[M + COOH]-
783.4961[M-H]-;
621.4304[M-H-Glu]-
√
M6
20.89
[M + COOH]-
C36H60O8
665.4269
620.4287
−0.1
Ginsenoside Rb1-4Glu-O + GluA
665.4289[M + COOH]-;
619.4239[M-H]-;
529.3150[M-H-C3H6O3]-;
473.3650[M-H-C3H6O3-C4H8]-;
471.3480[M-H-C3H6O3-C2H2O2]-; 441.3300[M-H-GluA-2H]-;
371.2968[M-H-GluA-2H-C5H10]-
√
M7
22.64
[M + COOH]-
C36H62O8
667.4424
622.4442
−0.5
Ginsenoside Rb1-3Glu
667.4395[M + COOH]-; 621.4354[M-H]-;
459.3854[M-H-Glu]-;
375.2851[M-H-Glu-C6H12]-
√
M8
24.61
[M−H]-
C30H52O4
475.3779
476.3852
−2.9
Ginsenoside Rg1-2Glu
475.3415[M-H]-;
457.3321[M-H-H2O]-;
439.3234[M-H-2H2O]-;
365.2836[M-H-3H2O-C4H8]-; 356.2787[M-H-4H2O-C4H8]-
√
3.4.1 Analysis of prototypes of RGR aqueous extract in rat serum, urine, feces and heart
A total of 10 prototypes in serum, 1 prototype in urine, 2 prototypes in feces and 5 prototypes in heart were detected in rats. Among them, dammarane-type compounds were the major compounds. The detailed information for the UPLC-Q-TOF-MS data of these prototypes was presented in Table 2.
3.4.2 Analysis of metabolites of RGR aqueous extract in rat serum and feces
A total of 1 metabolite in serum and 7 metabolites in feces were detected in rats. Published studies suggested that the primary physiological activities of RGR were the transformation of compounds by intestinal microorganisms (Kim, et al., 2019). According to their probable prototype compounds, the structure of metabolites could be classified into two groups: PPD-related and PPT-related. Among them, glucuronidation and methylation were the most prevalent metabolic reactions. Detailed information on the UPLC-Q-TOF-MS data of the metabolites was presented in Table 3. The proposed metabolic pathways of PPD and PPT in rats were displayed in Fig. 6 and Fig. 7, respectively.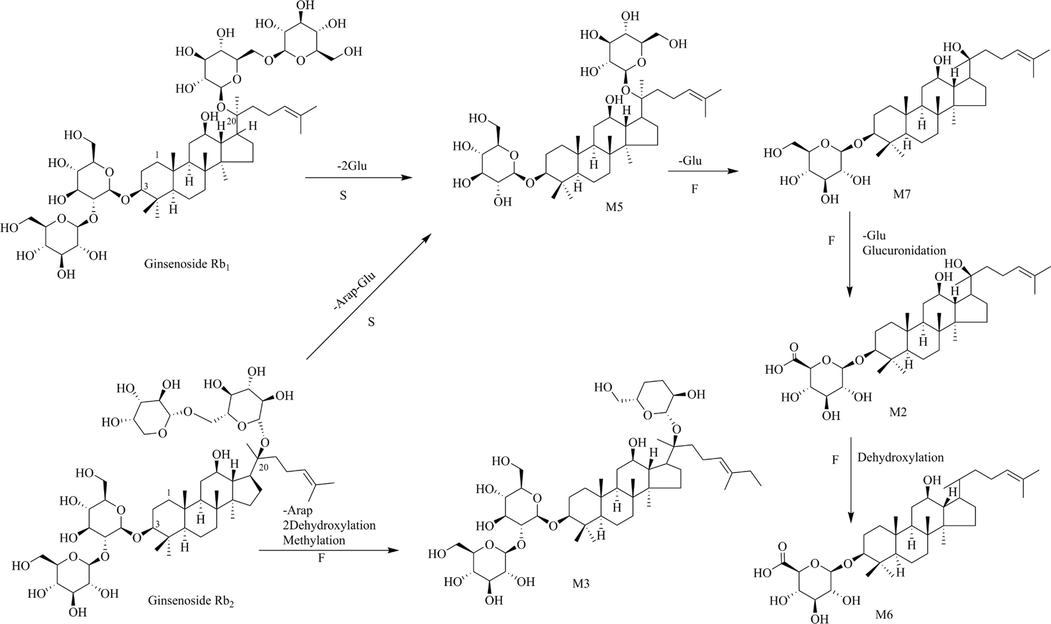
The proposed metabolic pathways of PPD in rats.

The proposed metabolic pathways of PPT in rats.
3.4.2.1 Identification of PPD-related metabolites
PPD-related metabolites were the major metabolites of RGR in vivo. In this study, a total of 5 PPD-related metabolites were tentatively characterized by comparison of the retention time, accurate mass and abundant fragment information. In addition, 1 metabolite in serum and 5 metabolites in feces were detected in rats.
The fragment ion [M−H−2Glu−C6H10O4]- at 457.2566 of M3 (RT = 20.11 min) was produced by losing one arabinose, two hydroxyl groups and one methyl group from the prototype ginsenoside Rb2, which suggested that M3 was discovered in feces after ginsenoside Rb2 experienced a series of metabolic reactions, including loss of arabinose and oxygen and addition of methylene.
M5 presented high-intensity [M + COOH]- and [M - H]- ions at m/z 829.5058 and m/z 783.4961 with a molecular formula of C42H72O13, and it contained two Glu (162 Da) less than the ginsenoside Rb1. Hence, M5 was characterized as its deglycosylated product. Similarly, M7 (RT = 22.64 min) exhibited an [M + COOH]- ion at m/z 667.4395 and an [M - H]- ions at m/z 621.4354, for which it was characterized as its deglycosylated product. Glucuronidation was also a major phase II metabolic reaction of ginsenosides in vivo.
The molecular formula of M2 was determined to be C20H20O8 with adduct ions at m/z 681.4254 [M + COOH]- and 635.4192 [M - H]-, and it was identified as a deglycosylated and glucuronidated product that had one Glu (162 Da) less and one C6H806 (176 Da) more than M7. In addition, M2 exhibited the [M + COOH]- ion at m/z 681.4254 and its product ions at m/z 489.3605 and m/z 457.3316. M6 exhibited the [M + COOH]- ion at m/z 665.4289 and its product ions at m/z 473.3650 and m/z 441.3300 were both 16 Da less than those of M2. Therefore, M6 was characterized as a dehydrogenated product of M2.
3.4.2.2 Identification of PPT-related metabolites
A total of 3 PPT-related metabolites were tentatively characterized in feces. M1 presented an [M - H]- ion at m/z 637.2699 with a molecular formula of C36H62O9, and it was one Glu (162 Da) less than ginsenoside Rg1. Hence, M1 was defied as its deglycosylated product. Similarly, M8 (RT = 24.61 min), exhibited the deprotonated [M - H]- ion at m/z 475.3415 and its fragment ions at 457.3321, 439.3234, 365.2836 and 356.2787, and was thus deduced to be the deglycosylated product of M1.
3.5 Identificatiocn of ginsenoside Rg1 metabolites
Based on the same strategy for a metabolic analysis of RGR in vivo, approximately 10 metabolites were tentatively identified in urine and feces samples after intragastric infusion of ginsenoside Rg1. In addition, the data presented in Table 4 detailed the specific information on the UPLC-Q-TOF-MS data of the metabolites of ginsenoside Rg1 in vivo. The EICs of metabolites obtained by UPLC-Q-TOF-MS under negative ion mode and the corresponding metabolic pathways of ginsenoside Rg1 in rats were proposed in Fig. 8 and Fig. 9, respectively. Note: √ means that compounds could have been detected in rat biological samples. U and F mean urine and feces, respectively.
No.
RT (min)
Selected ion
Formula
Measured ion
Mass (Da)
Error (ppm)
Identification
MS/MS fragmentation
U
F
Rg1
9.47
[M + COOH]-
C42H72O14
845.4938
800.4956
4.0
Ginsenoside Rg1
845.4958[M + COOH]-;
799.4907[M-H]-;
637.4337[M-H-Glu]-;
619.4254[M-H-Glu-H2O]-;
553.3408[M-H-Glu-C6H12]-;
475.3800[M-H-2Glu]-;
391.2858[M-H-2Glu-C6H12]-
√
MR1
6.78
[M + COOH]-
C42H72O15
861.4849
816.4867
−0.5
Ginsenoside Rg1 + O
861.4286[M + COOH]-;
815.4885[M-H]-;
799.4382[M-H-O]-;
773.4096[M-H-C3H6]-;
653.4322[M-H-Glu]-;
635.4251[M-H-Glu-H2O]-;
553.3408[M-H-Glu-C6H12-O]-;
491.3724[M-H-2Glu]-;
459.1719[M-H-2Glu-H2O-CH2]-;
391.2879[M-H-2Glu-C6H12-O]-
√
MR2
6.96
[M + COOH]-
C42H74O15
863.5015
818.5033
0.6
Ginsenoside Rg1 + H2O
863.4262[M + COOH]-
;817.5023[M-H]-;
655.4482[M-H-Glu]-;
637.4355[M-H-Glu-H2O]-;
493.3933[M-H-2Glu]-;
459.1709[M-H-2Glu-H2O-O]-;
443.1771[M-H-2Glu-H2O-2O]-;
419.1344[M-H-2Glu-C4H10O]-
√
MR3
8.58
[M + COOH]-
C36H62O10
699.4358
654.4376
4.7
GinsenosideRg1-Glu + O
699.4384[M + COOH]-;
653.4315[M-H]-;
553.3412[M-H-C6H12-O]-;
491.3770[M-H-Glu]-;
455.3530[M-H-Glu-2H2O]-;
403.3234[M-H-Glu-H2O-C5H10]-;
391.2854[M-H-Glu-C6H12-O]-
√
MR4
9.86
[M + COOH]-
C36H62O10
699.4350
654.4368
3.6
Ginsenoside Rg1-Glu + O
699.2368[M + COOH]-;
653.4317[M-H]-;
553.2997[M-H-C6H12-O]-;
491.3782[M-H-Glu]-;
391.2877[M-H-Glu-C6H12-O]-
√
MR5
13.33
[M + COOH]-
C30H52O5
537.3810
492.3828
2.5
Ginsenoside Rg1-2Glu + O
537.2626[M + COOH]-;
491.3768[M-H]-;
473.3664[M-H-H2O]-;
445.2268[M-H-H2O-2CH2]-;
391.2857[M-H-C6H12-O]-;
351.2717[M-H-C5H8-4H2O]-
√
MR6
14.51
[M + COOH]-
C36H62O9
683.4410
638.4428
5.0
Ginsenoside Rg1-Glu
683.4432[M + COOH]-;
637.3480[M-H]-;
553.3439[M-H-C6H12]-;
475.3828[M-H-Glu]-;
457.3703[M-H-Glu-H2O]-;
391.2877[M-H-Glu-C6H12]-
√
√
MR7
15.02
[M−H]-
C43H74O15
829.4961
830.5034
0.7
Ginsenoside Rg1 + CH2O
829.5017[M-H]-;
783.5017[M-H-CH2O-O]-;
637.4340[M-H-Glu-CH2O]-;
619.4214[M-H-Glu-CH2O-H2O]-;
475.3784[M-H-2Glu-CH2O]-;
457.1579[M-H-2Glu-CH2O-H2O]-
√
MR8
15.90
[M + COOH]-
C36H62O9
683.4410
638.4428
5.0
Ginsenoside Rg1-Glu
683.4418[M + COOH]-;
637.4352[M-H]-;
553.2933[M-H-C6H12]-;
475.3811[M-H-Glu]-;
457.3713[M-H-Glu-H2O]-;
391.2868[M-H-Glu-C6H12]-
√
√
MR9
21.67
[M + COOH]-
C30H52O4
521.3864
476.3882
3.1
Ginsenoside Rg1-2Glu
521.2963[M + COOH]-;
475.3410[M-H]-;
457.3358[M-H-H2O]-;
439.2880[M-H-2H2O]-;
391.2868[M-H-C6H12]-;
355.2892[M-H-C6H12-2H2O]-
√
MR10
25.65
[M−H]-
C37H64O8
635.4520
636.4593
−1.3
Ginsenoside Rg1-Glu-O + CH2
635.4556[M-H]-;
617.4439[M-H-H2O]-;
599.3883[M-H-2H2O]-;
459.4209[M-H-Glu-CH2]-;
417.4053[M-H-Glu-CH2-C3H6]-
√
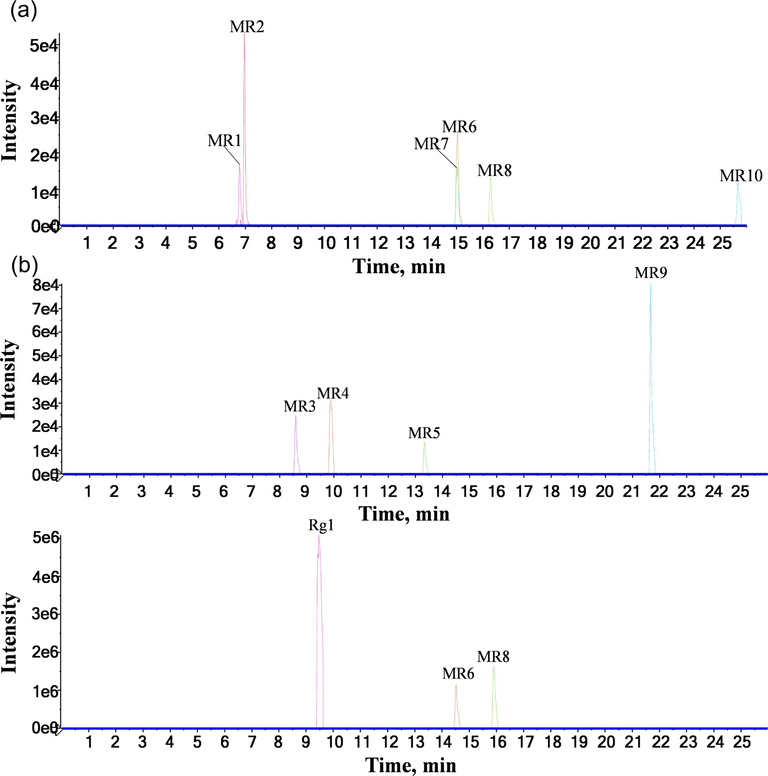
The EICs of metabolites of ginsenoside Rg1 by UPLC-Q-TOF-MS in negative ion mode. (a) urine, (b) feces.
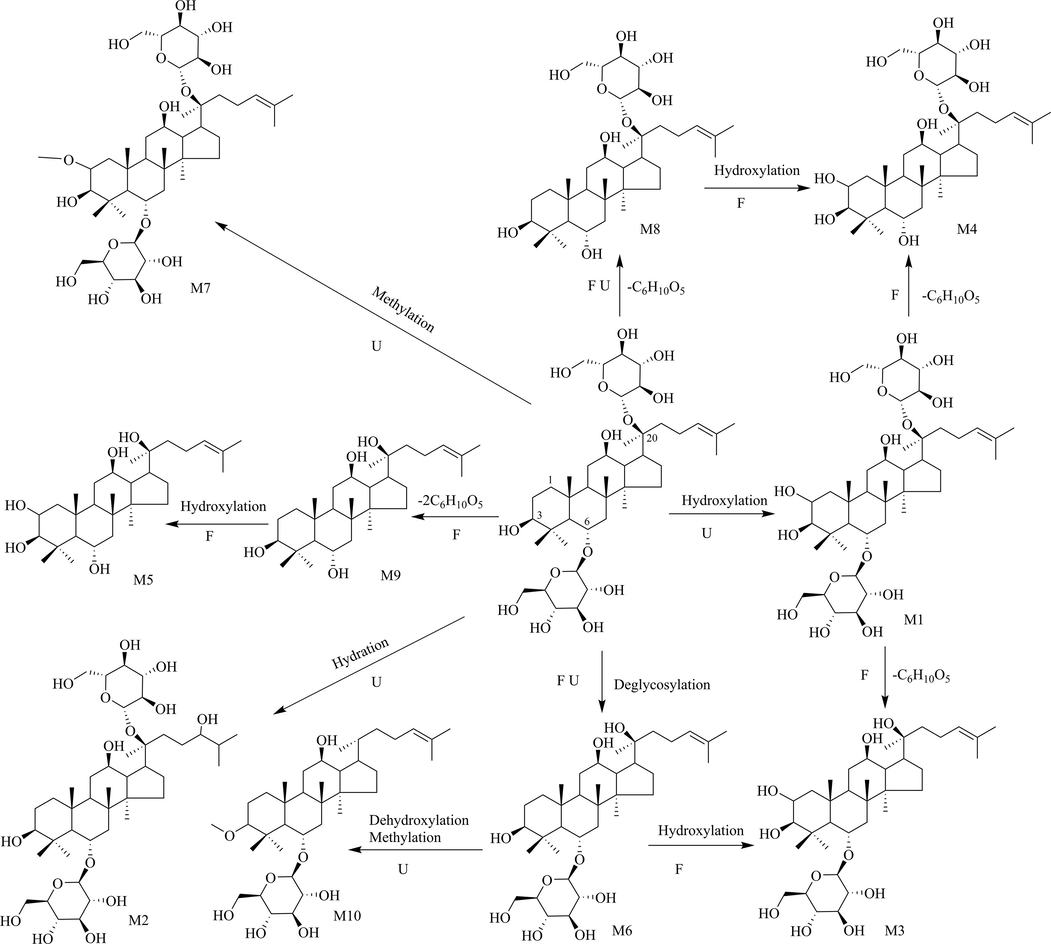
The proposed metabolic pathways of ginsenoside Rg1 in rats.
Ginsenoside Rg1 presented high-intensity [M + COOH]- and [M - H]- ions at m/z 845.4958 and 799.4907 with a molecular formula of C42H72O14.
MR7 (RT = 15.02 min) was identified as the methoxylated product of ginsenoside Rg1 because its molecular weight was one OCH2 (30 Da) higher than that of ginsenoside Rg1. MR2 (RT = 6.96 min) showed the [M + COOH]- ion at m/z 863.4262, which was determined to be C42H74O15 with a molecular weight H2O (18 Da) greater than that of ginsenoside Rg1. Thus, MR2 was inferred to be the hydroxylated product of ginsenoside Rg1.
In addition, MR8 (ClogP = 3.2341) was determined as an isomer of MR6 (ClogP = 3.7341) since it presented the same molecular formula as MR6. They were one Glu (162 Da) less than ginsenoside Rg1, indicating that they might be the deglycosylated products of ginsenoside Rg1. Similarly, MR3 (ClogP = 2.4999) was considered an isomer of MR4 (ClogP = 1.9999) due to the same molecular formula. The molecular ions at m/z 699 (MR3 and MR4) were one O (16 Da) more than m/z 683 (MR6 and MR8), respectively. Therefore, MR3 and MR4 were identified as hydrogenated products of MR6 and MR8, respectively.
MR10 (RT = 25.65 min) was produced by the loss of 2 Da, corresponding to the dehydrogenated and methylated product of MR6 (RT = 14.51 min). These results indicated that the ions of MR6 firstly lost one O of 16 Da and were methylated sequently. Therefore, MR10 was discovered in urine after MR6 experienced a series of metabolic reactions, including dehydroxylation and methylation. In addition to the reactions above, hydroxylated was the major reaction as well. MR1 (RT = 6.78 min) was assigned as a hydroxylated product of ginsenoside Rg1 because it contained more O (16 Da) than ginsenoside Rg1.
The molecular ion at m/z 521.2963 (MR9) was 2Giu (324 Da) less than m/z 845.4958 ginsenoside Rg1. MR9 was thought to be the deglycosylated product of ginsenoside Rg1. The molecular ion at m/z 537.2626 (MR5) was O (16 Da) more than MR9. Therefore, MR5 was assigned as the hydroxylated product of MR9. Ginsenoside Rg1 underwent deglycosylation and hydroxylation by comparison to the major metabolic pathways of RGR in vivo, which was supplemented with glucose. Besides, metabolites of the RGR aqueous extract were detected in rat serum and feces. In contrast, metabolites of ginsenoside Rg1 were only detected in rat urine and feces.
3.6 The results of the network pharmacology analysis
3.6.1 Targets collection of prototype compounds and HF
10 prototypes in rat serum and heart were shown in Supplementary materials sheet 1. To collect targets about them, Swiss Target Prediction and PharmMapper were used and 241 targets were obtained after deduplication (Supplementary materials sheets 2 and 3). Through a series of databases, 1156 targets related to HF were obtained (Supplementary materials sheet 4). Subsequently, the “compound-target” network (Fig. 10a) was displayed by Cytoscape 3.7.1 to visualize the relationship between them.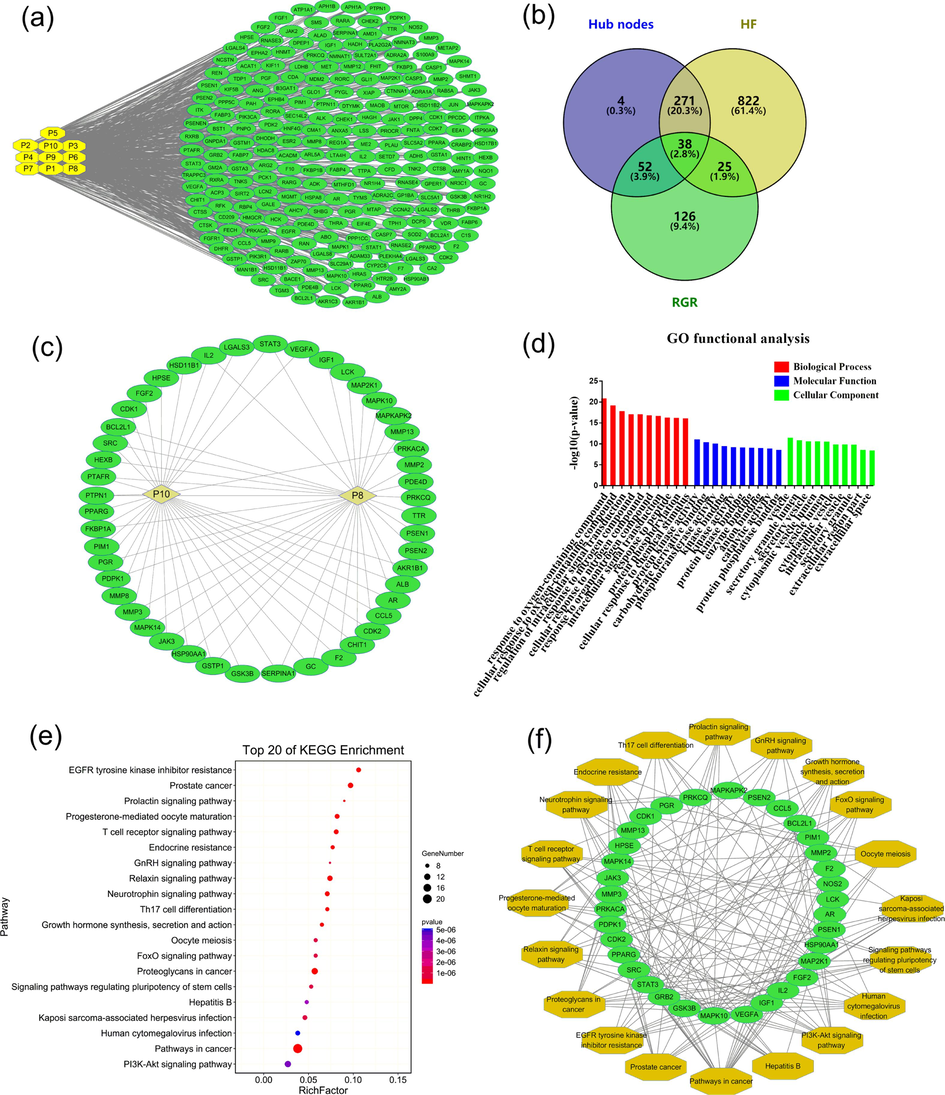
The diagram of network pharmacology analysis in rat serum and heart. (a) the “compound-target” network (the yellow and green represented prototypes and the corresponding targets, respectively). (b) the potential targets of RGR against HF. (c) the “key compound-the corresponding key target” network (the yellow and green represented key compounds and the corresponding key targets, respectively). (d) the secondary classification histogram of GO enrichment function analysis of key targets. (e) annotated bubble diagram of the top 20 KEGG pathways of key targets. (f) the “pathway-target” network (the green and yellow represented key targets and the corresponding signaling pathways, respectively). (For interpretation of the references to colour in this figure legend, the reader is referred to the web version of this article.)
3.6.2 Identification of key compounds and targets for RGR and HF
In the protein–protein interaction network, 365 hub nodes were identified (Supplementary materials sheet 5). Through the Venny 2.1.0 (Fig. 10b), the intersection of the compound targets, HF targets and hub nodes were obtained. It could be easy to see that there were 115 potential targets, including 63 direct targets and 52 indirect targets (Supplementary materials sheet 6). Two key compounds (ginsenoside Rh4 and ginsenoside Rg3) and 51 key targets were eventually obtained by meeting higher the median of BC, CC and DC (Supplementary materials sheet 7). Generally, In the interactive network, the greater the DC of the node, the more important it is (Chen, et al., 2019). The relationship between key compounds and key targets were shown in Fig. 10c.
3.6.3 The results of GO functional and KEGG pathway enrichment analysis
To further illustrate the mechanism of RGR on HF mitigation, 51 key targets were introduced into OmicShare for GO functional analysis and the KEGG pathway. As shown in Supplementary materials sheet 8, GO function enriched 2895 terms recognized in p < 0.5 contained 2478 BP, 250 MF and 167 CC. Additionally, the GO secondary classification histogram (Fig. 10d). There were mainly 115 limited pathways obtained by OmicShare for further screening (Supplementary materials sheet 9). The bubble diagram was made through OmicShare (Fig. 11e) and the “pathway-target” network (Fig. 11f).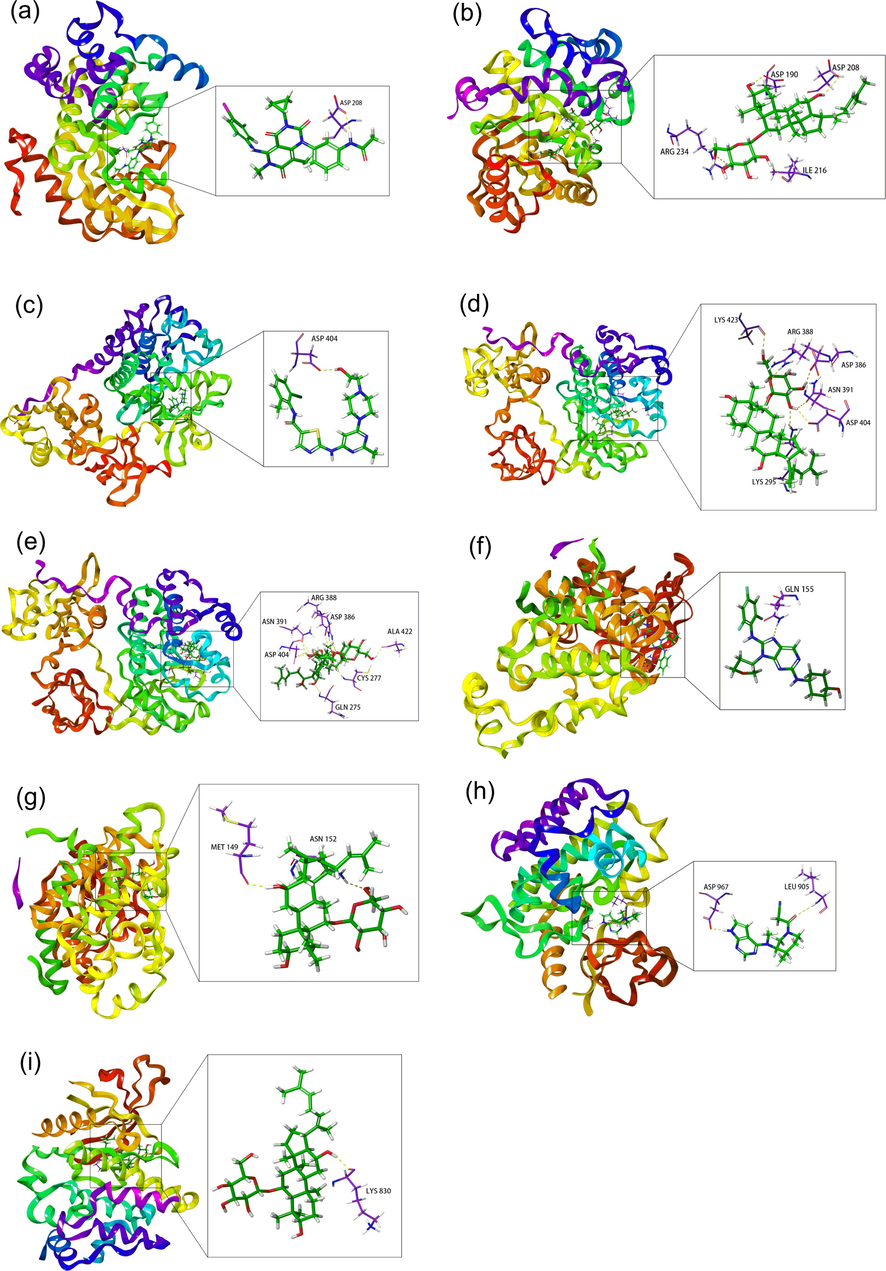
The molecule docking of ptential key compounds and targets. 3D interaction of trametinib (a) and ginsenoside Rh4 (b) at the active site of MAP2K1 (PDB ID:7B9L). 3D interaction of dasatinib (c), ginsenoside Rh4 (d) and ginsenoside Rg3 (e) at the active site of SRC (PDB ID: 2SRC). 3D interaction of tanzisertib (f) and ginsenoside Rh4 (g) at the active site of MAPK10 (PDB ID:3FV8). 3D interaction of tofacitinib (h) and ginsenoside Rh4 (i) at the active site of JAK3 (PDB ID:6DB3).
3.7 Molecular docking results
Molecule docking was used to further validate the binding mode between compounds and their target proteins. 15 targets, including the number of pathways associated with corresponding targets in excess of five, were selected from 51 targets for molecular docking. However, 5 out of 15 targets were not discussed for the lack of proper protein crystal structure. Of the remaining 10 targets, only four did receive molecular docking scores. Mitogen-activated protein kinase 10 (MAPK10), tyrosine-protein kinase src (SRC), dual specificity mitogen-activated protein kinase 1 (MAP2K1) and tyrosine-protein kinase jak3 (JAK3) were the major targets involved in RGR for the improvement of HF. We tentatively speculated that the compounds (ginsenoside Rh4 and ginsenoside Rg3) were related to the target proteins (MAPK10, SRC, MAP2K1, JAK3). And the positive control drugs for four protein targets of MAPK10, SRC, MAP2K1 and JAK3 chose their inhibitors tanzisertid, dasatinib, trametinib and tofacitinib (Plantevin Krenitsky, et al., 2012;Schenone, et al., 2010;Infante, et al., 2012;Dhillon, 2017), respectively, in combination with current research. The results of SP docking were detailed in Table 5. Then the RMSD was calculated by superposition module measured less than 2.0, indicating the SP docking method and parameter settings were reliable.
Target
PDB
compound
SP docking score
MAPK10
3FV8
Tanzisertid
−6.016
Ginsenoside Rh4
−4.746
SRC
2SRC
Dasatinib
−6.712
Ginsenoside Rh4
−6.535
Ginsenoside Rg3
−4.790
MAP2K1
7B9L
Trametinib
−5.333
Ginsenoside Rh4
−7.575
JAK3
6DB3
Tofacitinib
−5.645
Ginsenoside Rh4
−5.312
Of the four targets, only SRC had docking results with ginsenoside Rg3, but the value of docking score was higher than with dasatinib (Table 5). Ginsenoside Rh4 had docked with MAPK10, SRC, MAP2K1 and JAK3, but only the MAP2K1′s value of docking score was lower than that of trametinib. The SP docking score of SRC was close to that of dasatinib. Both MAPK10 and JAK3 possessed docking results with ginsenoside Rh4, but their docking scores of absolute values were higher than those of tanzisertid and tofacibinib, respectively. Taken together, ginsenoside Rh4 docking with SRC and MAP2K1 indicated their good interactions and verified the reliability of targets.
3.7.1 Molecular docking study between MAP2K1 and ginsenoside Rh4
As shown in Fig. 11a, trametinib formed a hydrogen bond interaction with ASP208. As shown in Fig. 11b, ginsenoside Rh4 formed a hydrogen-bond interaction with ASP208, ASP190, ILE216, and ARG234 exhibited good binding affinity. Hydrogen bonding and pi-pi stacking can improve the binding affinity and stability of the target protein to the compounds.
3.7.2 Molecular docking study between SRC and ginsenoside Rh4, ginsenoside Rg3
The interaction of dasatinib with SRC was shown in Fig. 11c, indicating hydrogen bonds with ASP404. As shown in Fig. 11d, ginsenoside Rh4 formed a hydrogen bond interaction with ASN391, ARG388, ASP386, LYS295, LYS423 and ASP404 exhibited a good binding affinity. The hydrogen bond interactions were formed between ginsenoside Rg3 and ASN391, ARG388, ASP386, ALA422, CYS277, GLN275 and ASP404 (Fig. 11e), notably exhibiting good binding affinity.
3.7.3 Molecular docking study between MAPK10, JAK3 and ginsenoside Rh4
The interaction of tanzisertib with MAPK10 was shown in Fig. 11f, indicating hydrogen bonds with GLN155. The interaction of ginsenoside Rh4 was represented in Fig. 11g, ginsenoside Rh4 formed a hydrogen bond interaction with MET149 and ASN152 exhibited a good binding affinity. In the result, ginsenoside Rh4 with JAK3 showed a good binding affinity of hydrogen bonds with LYS830 in Fig. 11i. Tofacitinib, showed the interaction with ASP967 and LEU905 via hydrogen bonds, which indicated that there was a better binding affinity and stability between tofacitinib and JAK3, the 3D interaction of tofacitinib was represented in Fig. 11h.
4 Discussion
RGR, a famous edible-medicinal herb, contains ginsenoside that have biologically beneficial effects on cardiovascular diseases such as inflammation, edema, cerebral apoplexy and myocardial infarction (Kim, et al., 2021). HF, the end of lots of heart diseases, including myocardial infarction, myocarditis, valvular heart disease and so on, has been a serious illness of cardiovascular disease (Ke, et al., 2020). Fortunately, RGR joined the HF mitigation gradually. Furthermore, the exploration of active ingredients and mechanism of RGR attenuating HF is not clear but necessary. Hence, the UPLC-Q-TOF-MS coupled with network pharmacology were used to attempt to explore it in this research.
As the therapeutic effects of RGR are often influenced by the quality of processing, the fingerprint analysis method was established to evaluate the quality of RGR indicating that the different sources had no significant influence on the quality of the herbs and that quality could be controlled.
Subsequently, UPLC-Q-TOF-MS was applied to characterize 41 chemical compounds of RGR aqueous extract. Most of them belonged to PPD, which had lower polarity and better absorbability than PPT. Significantly, the fragment ions at m/z 459, 475 and 455 were the characteristic ions of the dammarane or oleanane scaffolds. After oral administration, a total of 18 xenobiotics (10 prototypes and 8 metabolites) were identified in serum, feces, urine and heart. Among them, prototypes were all discovered in serum showed that they were absorbed in the body and entered the blood circulation. The metabolites might be excreted through the intestines, resulting from the abundance detected in feces. These results signified that phase Ⅰ metabolic pathways of RGR predominantly involve dehydroxylation and deglycosylation. The primary phase Ⅱ metabolic pathway was glucuronidation. Furthermore, the possible metabolic pathways by ginsenoside Rg1 made a substantial difference in verifying the metabolic pathways of RGR in vivo. However, no metabolites were detected in the serum of rats that were orally administered with ginsenoside Rg1. We tentatively conjectured that the dose of Rg1 was too low or that the timing of serum collection was unsuitable.
Then, network pharmacology had been developed to predict the targets of ingredients absorbed in serum and heart after oral administration of RGR. We tentatively discovered two compounds and 51 corresponding targets regulating 115 signaling pathways on RGR to attenuate HF. Among them, four targets, namely MAP2K1, MAPK10, SRC and JAK3, possessed the largest number of pathways, which were chosen for molecular docking. As a result, MAP2K1 was anticipated to have higher activity on account of a higher SP docking score of ginsenoside Rh4 than trametinib. The SP docking score of SRC combined with ginsenoside Rh4 was close to that of dasatinib. It was therefore estimated that ginsenoside Rh4 and two corresponding targets (MAP2K1 and SRC) were deemed to be the most possible effective ingredient and targets among them, respectively.
MAP2K1 is a member of the dual specificity protein kinase family. Wei Pan et al. found that the activation of MAP2K1 could cause the occurrence of atherosclerosis and angiogenesis in vivo and in vitro. In hypoplastic left heart syndrome of the left ventricle, it was found to be shown high expression of the state (Pan, et al., 2020). Furthermore, Fuller et al. had shown that mRNAs for MAP2K1 were downregulated in human failing hearts (Fuller, et al., 2015).
SRC, a non-receptor tyrosine kinase, has been confirmed to be an important factor in cardiovascular disease mechanisms on account of its important role in vascular physiology, inflammation and platelet activation. Not only does SRC serve as the primary ROS target in vascular smooth muscle, but it plays a significant role in smooth muscle proliferation and migration, which may be associated with oxidative stress-related vascular remodelling. Furthermore, the formation of actin contractile fibers was facilitated by SRC through its ability to tyrosine phosphorylate multiple protein targets (MacKay and Knock, 2015). These contribute to the alleviation of HF.
However, it is a pity that we did not verify the results of network pharmacology targets prediction and mechanism of action. We plan to verify our findings at the molecular level in the future.
5 Conclusion
In this research, the instinct similarity and stability of RGR samples were revealed by fingerprint analysis, which demonstrated that the quality of RGR was controllable. Furthermore, this study provided a detailed and comprehensive metabolic profile of RGR. Of them, the compounds in serum and heart were used to do network pharmacology coupled with molecular docking. As a result, 41 chemical compounds were identified from the RGR aqueous extract. A total of 10 prototypes and 8 metabolites were detected in serum, feces, urine and heart. The metabolic pathways of ginsenoside Rg1 were tentatively identified to confirm the metabolic profile of RGR. Additionally, ginsenoside Rh4 (P8), considered a potential active ingredient, and its two corresponding targets (MAP2K1, SRC) regulating 19 pathways were confirmed closely related to the pharmacological mechanism of RGR for attenuating HF. Our results explored the essence of RGR and succeeded to provide potential active ingredient and targets for further pharmacological study.
CRediT authorship contribution statement
Yinjie Wang: Conceptualization, Data curation, Formal analysis, Investigation, Methodology, Software, Visualization, Writing – original draft, Writing – review & editing, Funding acquisition, Project administration, Supervision. Wenhui Han: Software, Visualization, Writing – original draft, Writing – review & editing. Qianyi Feng: Data curation, Formal analysis, Investigation, Methodology, Software, Visualization. Baolin Xie: Data curation, Formal analysis, Methodology, Software, Visualization. Xiaoshan Chen: Writing – review & editing. Zhonghui Zheng: Investigation, Visualization. Zhilong Zhao: Funding acquisition, Project administration.
Acknowledgments
This study was supported by the Sponsorship Program for Young Scientific Talents of Ningxia Province (2017-2020), the Key Research and Development Program of Ningxia (No. 2016KJHM112), the D Level of High Precision and Shortage Talents of Yinchuan in 2022, the Academic and Technical Leaders Reserve Program Cultivate Candidates of Yinchuan in 2020 and the E Level of High Precision and Shortage Talents of Yinchuan in 2020.
Declaration of Competing Interest
The authors declare that they have no known competing financial interests or personal relationships that could have appeared to influence the work reported in this paper.
References
- Exploration in the mechanism of action of licorice by network pharmacology. Molecules. 2019;24(16)
- [Google Scholar]
- Daina A., Michielin O. ,Zoete V., 2019. SwissTargetPrediction: updated data and new features for efficient prediction of protein targets of small molecules. Nucleic Acids Res. 47 (W1), W357-W364.
- Molecular docking prediction and in vitro studies elucidate anti-cancer activity of phytoestrogens. Life Sci.. 2017;185:73-84.
- [Google Scholar]
- Cardiac protein kinases: the cardiomyocyte kinome and differential kinase expression in human failing hearts. Cardiovasc. Res.. 2015;108(1):87-98.
- [Google Scholar]
- Safety, pharmacokinetic, pharmacodynamic, and efficacy data for the oral MEK inhibitor trametinib: a phase 1 dose-escalation trial. Lancet Oncol.. 2012;13(8):773-781.
- [Google Scholar]
- Pharmacokinetics of ginsenosides following repeated oral administration of red ginseng extract significantly differ between species of experimental animals. Arch. Pharm. Res.. 2020;43(12):1335-1346.
- [Google Scholar]
- Ke Y., Wang M., Li Y., Shan Z., Mi W., Yuan P., Feng W. ,Zheng X., 2020. Oligosaccharides composition of Descurainiae sophia exerts anti-heart failure by improving heart function and water-liquid metabolism in rats with heart failure. Biomed. Pharmacother. 129.
- Simultaneous quantification of 14 ginsenosides in Panax ginseng C.A. Meyer (Korean red ginseng) by HPLC-ELSD and its application to quality control. J. Pharm. Biomed. Anal.. 2007;45(1):164-170.
- [Google Scholar]
- Enzymatic hydrolysis increases ginsenoside content in Korean red ginseng (Panax ginseng CA Meyer) and its biotransformation under hydrostatic pressure. J. Sci. Food Agric.. 2019;99(15):6806-6813.
- [Google Scholar]
- Improvement of antithrombotic activity of red ginseng extract by nanoencapsulation using chitosan and antithrombotic cross-linkers: polyglutamic acid and fucoidan. J. Ginseng Res.. 2021;45(2):236-245.
- [Google Scholar]
- Red Ginseng (Panax ginseng) decreases isoproterenol-induced cardiac injury via antioxidant properties in porcine. J. Med. Food. 2014;17(1):111-118.
- [Google Scholar]
- Control of vascular smooth muscle function by Src-family kinases and reactive oxygen species in health and disease. J. Physiol.. 2015;593(17):3815-3828.
- [Google Scholar]
- Comparative characterization of the ginsenosides from six panax herbal extracts and their in vitro rat gut microbial metabolites by advanced liquid chromatography-mass spectrometry approaches. J. Agric. Food Chem.. 2023;72(24):9391-9403.
- [Google Scholar]
- Pan W., Liang J., Tang H., Fang X., Wang F., Ding Y., Huang H. ,Zhang H., 2020. Differentially expressed microRNA profiles in exosomes from vascular smooth muscle cells associated with coronary artery calcification. Int. J. Biochem. Cell Biol. 118.
- Discovery of CC-930, an orally active anti-fibrotic JNK inhibitor. Bioorg. Med. Chem. Lett.. 2012;22(3):1433-1438.
- [Google Scholar]
- Network pharmacology and bioinformatics approach reveals the hypolipidemic mechanism of Dan Tian Jiang Zhi pill. Med. Chem. Res.. 2019;29(2):243-254.
- [Google Scholar]
- The correlations of adverse effect and tonifying effect of ginseng medicines. J. Ethnopharmacol.. 2022;291:115113
- [Google Scholar]
- In-silico study MAPK inhibition based lead identification from the isolated compounds of Croton oblongifolius Roxb for the treatment of hepatocellular carcinoma. Pharmacologyonline. 2019;1:301-318.
- [Google Scholar]
- Novel dual Src/Abl inhibitors for hematologic and solid malignancies. Expert Opin. Invest. Drugs. 2010;19(8):931-945.
- [Google Scholar]
- Chemical diversity of ginseng saponins from Panax ginseng. J. Ginseng Res.. 2015;39(4):287-298.
- [Google Scholar]
- Prevalence and incidence of heart failure among urban patients in China: A national population-based analysis. Circ. Heart Fail.. 2021;14(10):e008406.
- [Google Scholar]
- In vitro biotransformation of red ginseng extract by human intestinal microflora: metabolites identification and metabolic profile elucidation using LC-Q-TOF/MS. J. Pharm. Biomed. Anal.. 2014;98:296-306.
- [Google Scholar]
- Steaming-induced chemical transformations and holistic quality assessment of red ginseng derived from panax ginseng by means of HPLC-ESI-MS/MSn-based multicomponent quantification fingerprint. J. Agric. Food Chem.. 2012;60(33):8213-8224.
- [Google Scholar]
- Change of ginsenoside composition in red ginseng processed with citric acid. Food Sci. Biotechnol.. 2010;19(3):647-653.
- [Google Scholar]
- Similarity system theory to evaluate similarity of chromatographic fingerprints of Traditional Chinese Medicine. Chin. J. Chromatogr.. 2005;23:158-163.
- [Google Scholar]
- Holistic quality evaluation of commercial white and red ginseng using a UPLC-QTOF-MS/MS-based metabolomics approach. J. Pharm. Biomed. Anal.. 2012;62:258-273.
- [Google Scholar]
- Metabolic disturbance in Korean red ginseng-induced “Shanghuo” (excessive heat) J. Ethnopharmacol.. 2020;253:112604
- [Google Scholar]
- Hyphenated chromatography detection and compound-target-disease investigation on herb-pair Chuanxiong Rhizoma - Xiangfu Rhizoma. J. Ethnopharmacol.. 2019;243:112125
- [Google Scholar]
- Exploring the mechanism of action Xianlingubao Prescription in the treatment of osteoporosis by network pharmacology. Comput. Biol. Chem.. 2020;85:107240
- [Google Scholar]
- Systems Pharmacology-based approach to comparatively study the independent and synergistic mechanisms of Danhong injection and Naoxintong capsule in ischemic stroke treatment. J. Evidence-Based Complementary Altern. Med.. 2019;2019:1-17.
- [Google Scholar]
Appendix A
Supplementary material
Supplementary data to this article can be found online at https://doi.org/10.1016/j.arabjc.2023.105383.
Appendix A
Supplementary material
The following are the Supplementary data to this article:Supplementary data 1
Supplementary data 1
Supplementary data 2
Supplementary data 2
Supplementary data 3
Supplementary data 3


