

Translate this page into:
Characteristics and quantification of mechanisms of Cd2+ adsorption by biochars derived from three different plant-based biomass
⁎Corresponding authors. feihuang2011@163.com (Fei Huang), ecoxiaorb@163.com (Rongbo Xiao)
-
Received: ,
Accepted: ,
This article was originally published by Elsevier and was migrated to Scientific Scholar after the change of Publisher.
Abstract
The physicochemical properties of biochars derived from rice straw, eucalyptus leaves, and vetiver grass pyrolyzed at 400 °C were investigated. It was found that rice straw biochar (RSB) may possess more acidic functional groups than eucalyptus leaves biochar (ELB) and vetiver grass biochar (VGB) while the specific surface area of VGB was the largest. Cd2+ adsorption characteristics by the three biochars were established under the effects of time, initial pH and concentration of solution. Maximum adsorption capacities of RSB, ELB, and VGB calculated by Langmuir model were 57.87 mg/g, 50.21 mg/g, and 44.09 mg/g, respectively, reflecting adsorption mechanisms may be dominated by chemical reaction than physical interaction. SEM-EDS, XRD, FTIR and XPS were employed before and after adsorption to qualitatively explore possible adsorption mechanisms of the three biochar. It was found that precipitation, ion exchange, complexation and cation π interaction occurred in all the biochars. The relative contribution of the four main mechanisms to total adsorption capacity was quantitatively determined, suggesting precipitation, ion exchange, and cation π interaction were dominated for the three biochar, while complexation accounted for an insignificant part. This study clearly demonstrated mineral constituents of biochar had significant effects on Cd2+ adsorption by plant-based biochars, shedding some light on their future application.
Keywords
Feedstocks
Biochar
Cadmium
Adsorption mechanisms

1 Introduction
Cadmium (Cd) mainly come from mining, dyeing, electroplating, smelting, and fertilizer application, which was then transferred into rivers, lakes and agricultural land through atmospheric deposition, rain wash, surface runoff, underground seepage, etc., endangering the surrounding animals, plants and human health (Hu et al., 2020; Yang et al., 2018). It was discovered that Cd2+ could not only cause oxidative stress to plants, also damage roots and leaves, reducing crop yields (Liu et al., 2020). Moreover, human ingestion of food contaminated with Cd2+ could result in damage to bone and kidney (Qin et al., 2021). Therefore, cleaning up cadmium-contaminated wastewater is of great significance. Traditional strategies for removing heavy metal polluted wastewater mainly included chemical precipitation, ion exchange, adsorption, membrane filtration, etc. (Fu and Wang, 2011). Among them, adsorption was increasingly popular due to its high efficiency, low cost, and environmental friendliness (F. Wu et al., 2021).
Biochar is produced by the pyrolysis of biomass under oxygen-limited conditions, usually consisting of porous carbon structures and ash, which are generated by decomposing organic matter into gases like CO2, H2, etc. during the pyrolysis process (Ahmad et al., 2014; Tan et al., 2015). The carbon structure of biochar is rich in oxygen-containing functional and aromatic groups, while the ash contains a large number of cations and anions (Xu et al., 2017). In addition, biochar is generally negatively charged, in favor of attracting cationic pollutants (Zhao et al., 2020). These characteristics also enabled biochar to be utilized as an effective adsorbent for Cd2+ adsorption (Yu et al., 2021). Moreover, previous studies revealed that biochar adsorbed Cd2+ mainly through four mechanisms: (1) precipitation with CO32–, PO43-, OH– etc. (Chang et al., 2019); (2) exchange with alkali metal ions K+, Na+, Ca2+, Mg2+ (Lian et al., 2020); (3) coordination with structures rich in π electrons such as C⚌C, C⚌N, —CH (Yu et al., 2018); (4) complexation with oxygen-containing functional groups (OFGs) like —OH and —COOH (Chen et al., 2021; Wang et al., 2020). For instance, the adsorption of Cd2+ and Pb2+ by ragweed biochar was mainly through precipitation and ion exchange (Lian et al., 2020). Biochar derived from biomass with high content of alkali metals possessed great adsorption capacity for heavy metals by means of enhanced ion exchange (H. Li et al., 2020; J. Wu et al., 2021). Precipitation and complexation were the main mechanisms in Cd2+ adsorption by both pinecone and wheat straw biochar (Chen et al., 2020; Teng et al., 2020). Cation π interaction of corn straw biochar contributed to 82.17% of total Cd2+ adsorption capacity because of low content of ash and OFGs (Wang et al., 2018). Hence, it was apparent that mechanisms in plant-based biochar adsorbing Cd2+ were connected to both feedstock types and the composition of their corresponding biochar.
Previous studies of Cd2+ adsorption mechanisms by biochars were mainly qualitative analysis without quantification. Besides, the quantitative analysis of Cd2+ adsorption mechanisms usually compared biochars manufactured by feedstocks with significantly obvious difference such as sludge, straws, manure, husks etc (Gao et al., 2019; Wang et al., 2018; Wu et al., 2019). There was a lack of studies focusing on biochars with relatively less difference produced by different plant-based biomass when it comes to the comparison of adsorption characteristics and quantitative analysis of their respective Cd2+ adsorption mechanisms. The common types of plant-based biomass can be classified into woods, straws, leaves, grass etc. Generally, woods grow much slower than the others and cost more to obtain compared to the other three. Rice, eucalyptus, and vetiver grass are widely planted in southern China in the paddy field, economic forest and cultivated lands, respectively. In the autumn, the rice straw was often abandoned or burned while the eucalyptus leaves fell to the ground without utilization. Although the roots of vetiver grass could be used to make perfume, the aboveground parts were poorly utilized. Therefore, the three feedstocks could be representatives of the common types of plant-based biomass in southern China, which were easy to obtain and had the potential to be transformed into relatively cheap adsorbents such as biochar, bringing huge economic and environmental benefits. It was reported that adsorption mechanisms in biochar were more affected by feedstock types than pyrolysis temperature (Gao et al., 2019). Therefore, the three types of plant-based biomass typical of southern china were selected as raw feedstocks carbonized at 400 °C for producing biochar in this study. The research aims were to: (1) explore the adsorption characteristics of the three biochars; (2) compare adsorption differences in the three types of biochar considering their physicochemical properties; (3) quantitatively estimate the relative contribution of the four main adsorption mechanisms to the total adsorption capacity of each biochar.
2 Methods and materials
2.1 Biochar preparation and characteristics
Rice straw (RS), eucalyptus leaves (EL), and vetiver grass (VG) were sourced from the Ecological Farm of South China Agricultural University. The raw materials were oven-dried at 80 °C for 48 h and then ground to sieve through 2 mm sieve. The powdered biomass was put into a stainless-steel reactor, and then pyrolyzed in a muffle furnace filled with nitrogen. The pyrolysis temperature was increased to 400 °C at a heating rate of 10 °C/min and held for 2 h. The resultant biochar, marked as RSB, ELB, and VGB, was pulverized through a 0.25 mm sieve for subsequent characterization analysis and adsorption experiments. Demineralized biochar was prepared by the raw biochar reacting with 1 M HCl, then rinsed with deionized water until the pH was constant. Previous studies had shown that this process did not significantly change OFGs on the surface of biochar (Cui et al., 2016a).
The pH of biochar was measured by shaking biochar with deionized water at 1:20 (w/v) for 24 h. Ash content was determined by burning biochar in a muffle furnace at 800 °C for 5 h. BET specific surface area was determined by nitrogen adsorption method (ASAP2460, USA). The content of C, H, O, N, S was detected by element analyzer (Vario EL cube, Germany). Zeta potential at different pH values was measured by a potentiometer (Malvern, Zetasizer Nano ZS90, UK). SEM-EDS, XRD, FTIR, XPS were used to analyze the surface characteristics of biochar before and after Cd2+ adsorption.
2.2 Adsorption experiments
In batch adsorption experiment, 0.02 g of biochar was added to a centrifuge tube containing 20 mL of Cd2+ solution with specific initial concentration. The mixed liquor was shaken at 25 °C and 150 rpm for 12 h, then passed through a 0.45 um filter membrane. The residual Cd2+ concentration was measured by an atomic absorption spectrometer. In order to explore the effect of initial solution pH value on adsorption, Cd2+ solution (100 mg/L) was adjusted to the pH range of 2 ∼ 8 with HCl and NaOH prior to biochar addition. For adsorption kinetics experiment, biochar was added to Cd2+ solution with an initial concentration of 20 mg/L and 100 mg/L, respectively, and the remaining concentration of the reaction solution taken out at different time points was measured. Adsorption isotherm experiment was carried out with different initial Cd2+ concentration ranging from 0 to 320 mg/L. All the experiments were done in triplicate. The kinetics data was fitted with pseudo-first-order (1) pseudo-second-order (2) and Elovich (3) models, and the isotherms data with Freundlich (4) and Langmuir (5) models.
2.3 Contributions of different adsorption mechanisms
The relative contribution of four types of adsorption mechanisms of biochar to the total adsorption capacity of Cd2+ was quantitatively calculated through formulas (6), (7), (8), (9) according to previous researches (Gao et al., 2019; Wang et al., 2015).
3 Results and discussion
3.1 Biochar characterization
The physicochemical properties of the three biochars were listed in Table 1. BET specific surface area (SSA) of RSB, ELB, and VGB were 5.19, 4.60, and 92.88 m2/g, respectively. Although the pore volume of RSB and VGB were similar, the average pore size of RSB was 15.56 nm while that of VGB was 2.54 nm. Thus, it could be inferred that the micropore structures formed more in VGB than in RSB during the pyrolysis process, resulting in higher surface area of VGB than RSB (Liu and Fan, 2018). Similarly, compared with ELB, the higher pore volume and smaller pore size of VGB was measured, leading to the higher surface area of VGB than ELB. Besides, the lower SSA of RSB and ELB compared to VGB may also result from the incomplete decomposition of organic impurities of RSB as well as the broken and collapsed pores of ELB, as suggested in SEM photographs (Fig. 1). The highest and lowest ash content existed in RSB and ELB, respectively, showing RSB had more inorganic mineral substance than the remaining biochars, which agreed with its total content of soluble K+, Na+, Ca2+, Mg2+. XRD was employed to establish the crystalline minerals in the ash as shown in Fig. 5A, and except that MgSiO3 solely existed in RSB, the mineral peaks of KCl and CaCO3 appeared in the three biochars, which may exchange or precipitate with Cd2+ during the adsorption process (Huang, et al., 2018). Generally, there were few mineral peaks in VGB in XRD spectra in contrast to RSB and ELB, which implied minerals in the ash of VGB were mainly amorphous (J. Li et al., 2019). All the biochar was alkaline with similar pH values, 8.59 (RSB), 8.68 (ELB), and 8.42 (VGB). Previous studies mentioned that alkaline matter in biochar’s ash as well as basic functional groups (BFGs) such as —NH2 and C⚌N and acidic functional groups (AFGs) like carboxyl and hydroxyl on the surface of biochar influenced pH values to a larger extent (Xu et al., 2017). However, the ratios of N/C based on elemental analysis of the three biochars were similar, reflecting a similar content of BFGs, which was verified by similar intensity of peaks attributed to —C⚌N at 786 cm−1 (RSB), 779 cm−1 (ELB) and 811 cm−1 (VGB) of FTIR spectra in Fig. 5B (Wang et al., 2021). It was thus inferred that more AFGs for RSB might be required to neutralize its higher amount of alkaline matter in the ash. The difference in the content of AFG was reflected by the significantly distinct C1s and O1s spectra of the three biochar as seen in Figs. 6 and 7. Elemental analysis also demonstrated that RSB had the lowest carbon percentage, which meant ELB and VGB were relatively more aromatic and hydrophobic (Wang and Wang, 2019). Moreover, RSB had the highest content of O and H, leading to the highest ratio of H/C and O/C. This further revealed RSB may carry more AFGs than ELB and VGB (Cui et al., 2016b). This was also supported by FTIR spectra (Fig. 5B), where RSB displayed the highest intensity of C⚌O stretching vibration of carboxyl at 1611 cm−1 (RSB) compared to peaks at 1580 cm−1 (ELB) and 1598 cm−1 (VGB) (Chang et al., 2019). ND stood for not detected.
Sample
pH
Ash (%)
SBET (m2/g)
Pore volume (cm3/g)
Average pore size (nm)
Elemental content %
Atomic ratio
Soluble cations content (mg/g)
C
H
O
N
S
H/C
O/C
N/C
K+
Na+
Ca2+
Mg2+
Total
RSB
8.59
26.65
5.19
0.021
15.56
48.70
2.74
19.93
1.36
0.34
0.68
0.31
0.024
31.72
ND
0.30
0.95
32.97
ELB
8.68
10.53
4.60
0.012
12.29
65.56
2.44
18.71
2.05
0.19
0.45
0.21
0.027
8.92
0.82
1.56
0.72
12.02
VGB
8.42
19.84
92.88
0.023
2.54
62.06
2.01
15.24
1.29
0.82
0.39
0.18
0.018
14.71
0.33
1.34
1.19
17.57
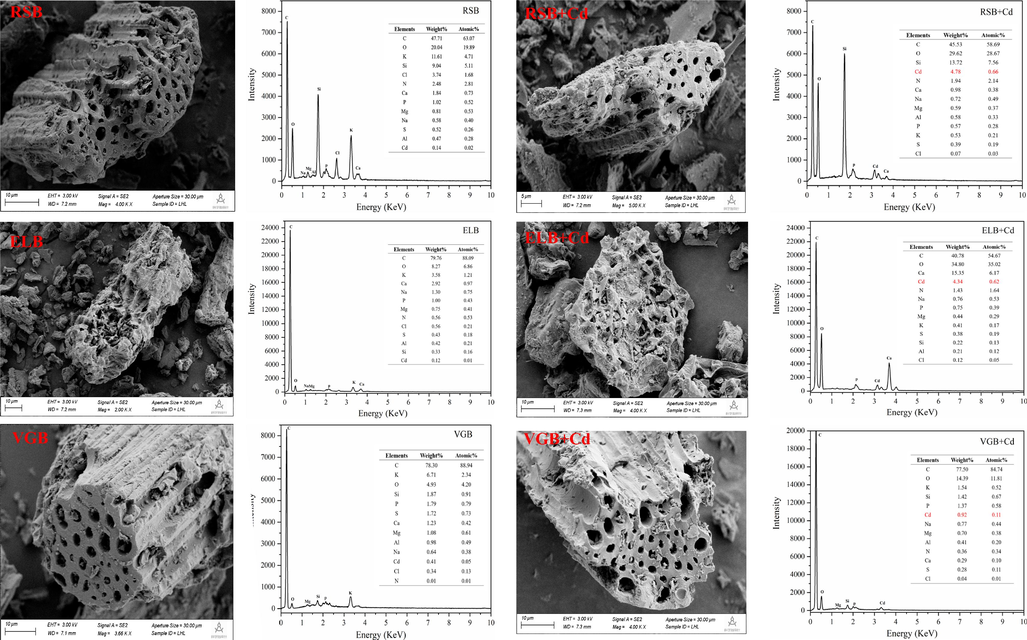
SEM images and EDS energy spectra of the three biochar before and after Cd2+ adsorption.
3.2 Adsorption characteristics
3.2.1 Influence of pH
Initial pH of solution affected both Cd2+ speciation and the zeta potential of biochar (Chang et al., 2019), which usually decreased with the increasing pH value. pHIEP was the initial pH of solution at which zeta potential of biochar equaled zero (Mukherjee et al., 2011). The pHIEP of the three biochars was in the range of 2 ∼ 3 (RSB, VGB) and 3 ∼ 4 (ELB), respectively (Fig. 2B).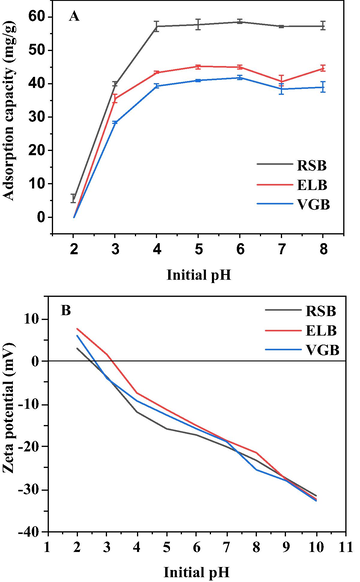
Influence of initial pH on Cd2+ adsorption by the three biochars (A). Zeta potential of the three biochars at different initial pH (B).
When the initial pH of Cd2+ solution was 2, the adsorption capacity of all the biochar was close to zero (Fig. 2A). The reason was probably that when pH < pHIEP, biochar was positively charged due to the protonation of functional group, causing electrostatic repulsion, and H+ would compete with Cd2+ for adsorption sites as well (Yin et al., 2019). As the initial solution pH rise to 4, the adsorption capacity of the three biochars increased rapidly and approached equilibrium. This was because AFGs of the biochar were deprotonated with alkalinity increasing, giving rise to a negatively-charged surface (Guo et al., 2019). However, the adsorption capacity began to increase again at pH = 8, which may result from precipitation of Cd(OH)2 emerging under alkaline condition (Zhang et al., 2018). The optimal pH of RSB and VGB for Cd2+ adsorption was 6, while that of ELB was 5, which was in line with what had been stated in literature that the best initial solution pH for cations adsorption by biochar was in the range of 4–7 (X. Li et al., 2020).
3.2.2 Adsorption kinetics
As illustrated in Fig. 3, the adsorption capacity of the three biochars added to two different initial concentrations of Cd2+ solution increased rapidly in 30 min, and reached equilibrium within 3 h for all the biochar. Overall, RSB had the largest adsorption capacity, followed by ELB and VGB. Three kinetic models were used to fit the adsorption data (Table S1). It was found that Elovich model fitted the best for the three biochars, with all the regression coefficients greater than 0.99, indicating that the adsorption process was via heterogeneous diffusion mechanism (Tang et al., 2019). Moreover, all the regression coefficients of pseudo-second-order model exceeded 0.97. The calculated adsorption capacity (Qe,cal) of the three biochars obtained by pseudo-second-order model were very close to their actual adsorption capacity. These indicated that chemisorption also occurred in the adsorption process of the three biochars (Zhou et al., 2019).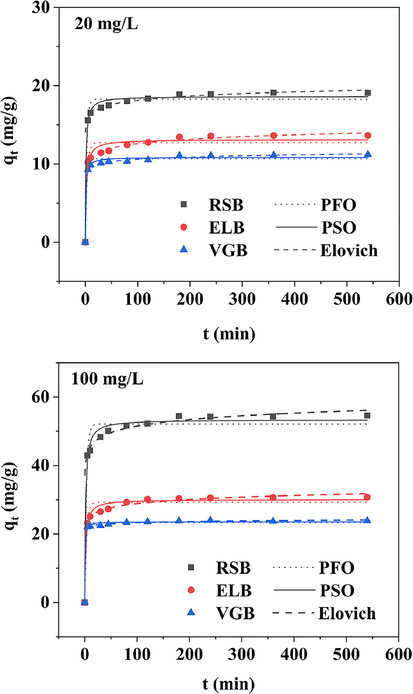
Adsorption kinetics of the three biochars at two different initial concentrations of Cd2+ solution.
3.2.3 Adsorption isotherms
With the increase of the initial concentration of Cd2+ solution, the adsorption capacity of the three biochars for Cd2+ increased rapidly (Fig. 4). When the initial concentration was greater than 200 mg/L, the adsorption capacity began to stabilize. The maximum adsorption capacity of the three biochars was 60.55 mg/g (RSB), 43.25 mg/g (ELB), and 33.1 mg/g (VGB), respectively, indicating biochar produced from rice straw had the greatest potential in removing Cd2+ from contaminated wastewater compared to the remaining two biochars. Although the specific surface area of VGB was the largest along with its bigger pore volume than ELB, its adsorption capacity was the smallest. Previous studies had also shown that Cd2+ adsorption capacity of biochar produced at a temperature below 500 °C had little to do with specific surface area, implying the adsorption mechanisms may be dominated by chemical reaction such as precipitation, ion exchange and so forth rather than physical interaction (Peng et al., 2017).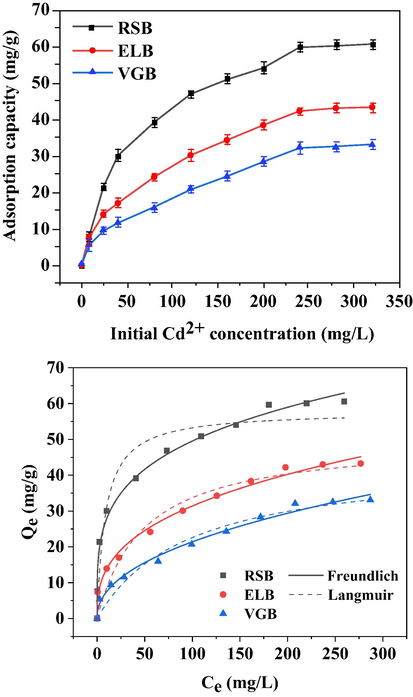
Influence of various initial Cd2+ concentrations on adsorption by the three biochars and isotherms fitting.
The adsorption data was fitted with Freundlich and Langmuir model (Table S2). The fitting coefficients of the former were all greater than 0.98, while that of the latter were all less than 0.96, indicating that chemical adsorption by the three biochars was multilayer (Y. Li et al., 2020). In addition, the maximum adsorption capacity of the three biochars calculated by Langmuir model was 57.87 mg/g (RSB), 50.21 mg/g (ELB), 44.09 mg/g (VGB), respectively. Compared with other pristine biochars (Table S3), the maximum adsorption capacity of the three biochars was superior to husk-based biochars (6.36–28.99 mg/g) (Cheng et al., 2016; Xiang et al., 2018), but inferior to sludge-based and other straw-based biochars (57.88–110.20 mg/g) (Gao et al., 2019; Liu and Fan, 2018; Ni et al., 2019; Sui et al., 2021; Xue et al., 2019). Besides, it seemed different manure-based biochars had significant difference in their adsorption capacity (31.30–149.55 mg/g) (Deng et al., 2018; Huang et al., 2018; Wang et al., 2020). On the whole, straw-based biochar may possess better adsorption efficiency towards Cd2+ than other plant-based biochar.
3.3 Quantification of adsorption mechanisms
3.3.1 Precipitation
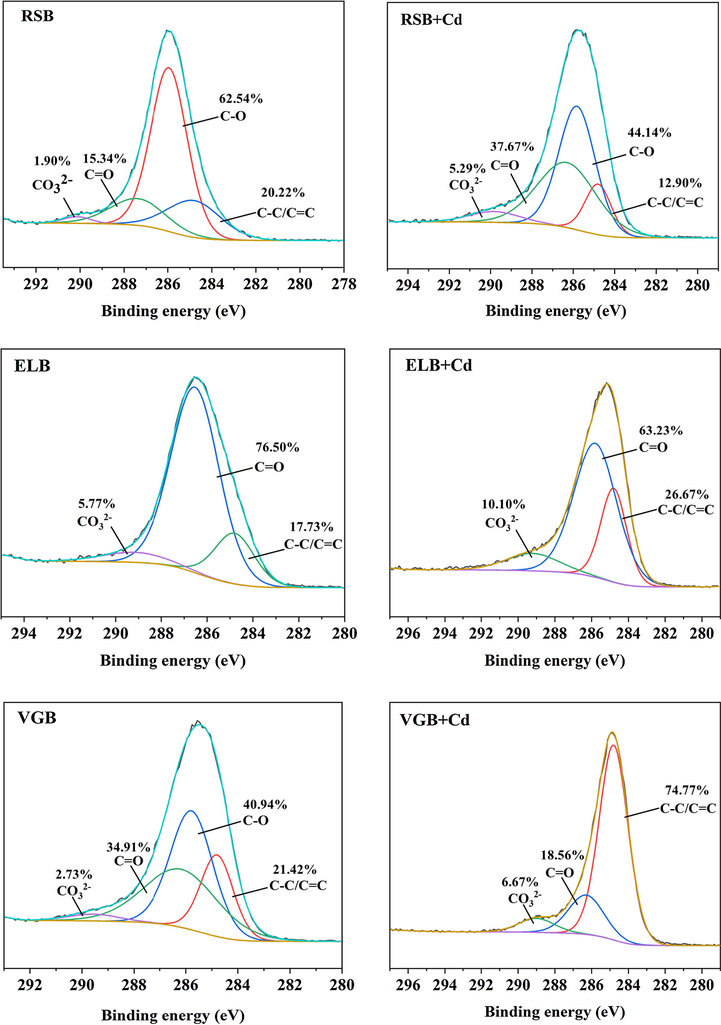
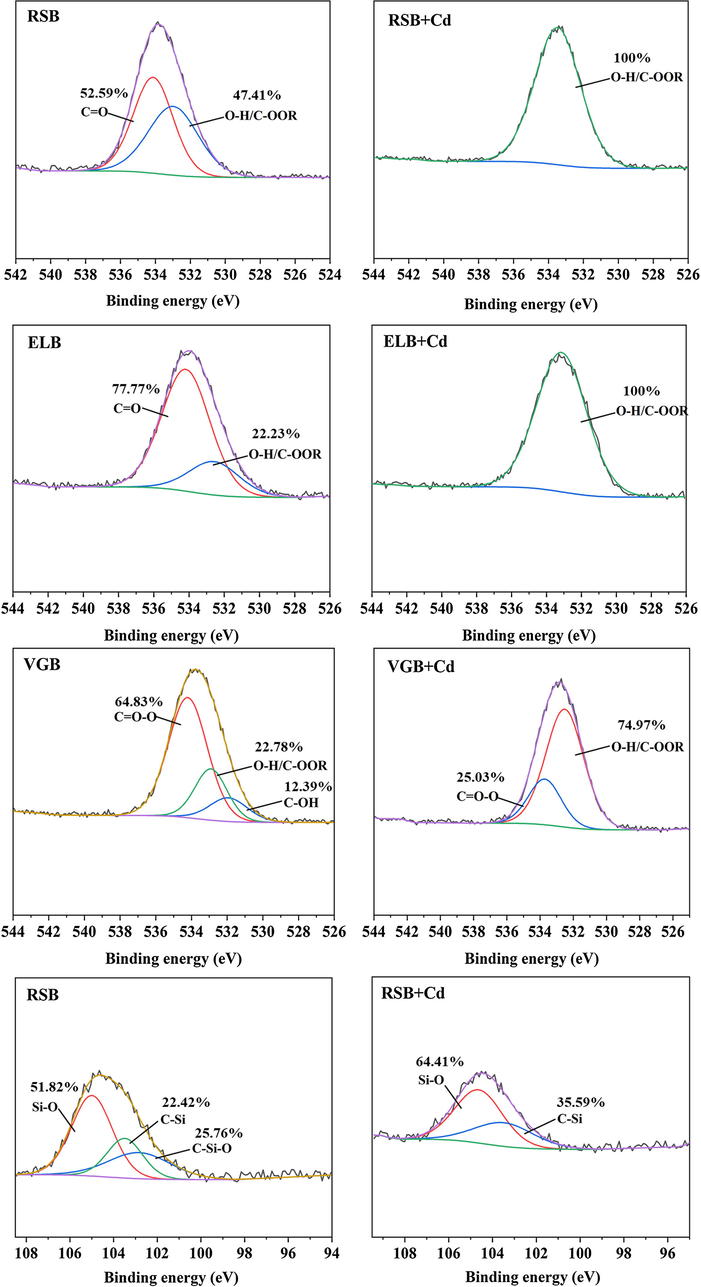
XRD were performed to determine the difference in crystalline mineral of the three biochars before and after adsorption (Fig. 5A). The number and intensity of mineral peaks of the three biochars changed obviously after adsorption, showing precipitate made contributions to their Cd2+ adsorption. On the whole, there were four mineral peaks belonging to cadmium precipitate, CdCO3, CdSiO3, CdP2 and Cd2(OH)3Cl. Particularly, it could be seen that new mineral peaks of CdCO3 appeared on the surface of the three biochars after adsorbing Cd2+. This was also confirmed by the XPS spectra of C1s in Fig. 6, where peaks of CO32− at the binding energy of 290.14 eV (RSB), 289.12 eV (ELB) and 289.56 eV (VGB) increased from 1.90% to 5.29%, 5.77% to 10.10%, 2.73% to 6.67%, respectively (Cai et al., 2021). In FTIR spectra (Fig. 5B), the peaks attributed to CO32– from 1420 cm−1 to 1435 cm−1 shifted after adsorption by the three biochars (Huang, et al., 2018). These indicated that soluble CO32– in the three biochars was consumed in the adsorption process. Mineral peaks ascribed to CdSiO3 and Cd2(OH)3Cl solely arose in RSB, while CdP2 in ELB. It had been reported that biochar derived from rice straw was abundant in silicon, which was also verified by EDS, showing that RSB had the highest silicon content (J. Li et al., 2019). The participation of silicon compounds in Cd2+ adsorption by RSB was also proved by the XPS spectra of Si2p, which was divided into three peaks, C—Si—O at the binding energy of 102.83 eV, C—Si (103.49 eV), Si—O (104.99 eV) (Cai et al., 2021). The peak of C—Si—O disappeared after Cd2+ adsorption, and the ratio of C—Si and Si—O increased from 22.42% and 51.82% to 35.59% and 64.41%, respectively, demonstrating SiO32- precipitated with Cd2+ (Fig. 7). The observed Cd2(OH)3Cl may result from the co-precipitation between cations and anions, as described by the following equation (Kim et al., 2014):
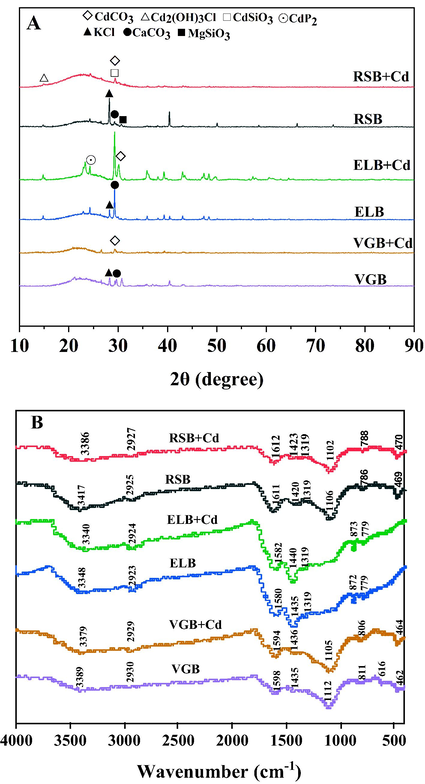
XRD (A) and FTIR (B) spectra of the three biochar before and after adsorption.
C1s spectra of the three biochar before and after adsorption.
O1s spectra of the three biochar and Si2p spectra of RSB before and after adsorption.
CdP2 in ELB was formed by reacting Cd2+ with reductive P, which synchronized with the release of CH4, H2, and CO in the pyrolysis process (Huang et al., 2020). It was certain that biochar produced from different biomass could bring differences in adsorption products due to their different composition.
The majority of biochar minerals could be removed by washing with HCl. Therefore, the quantitative contribution of precipitation to Cd2+ adsorption could be determined by the adsorption difference between original biochar and demineralized biochar (Gao et al., 2019). It was rather remarkable that the results of quantitative analysis disclosed that precipitation contributed the most to the total adsorption capacity of the three biochars, with the ratio of 55.94% (RSB), 52.25% (ELB), and 52.41% (VGB), respectively (see Fig. 8). This also made it clear that ash in the three biochars had great effects on Cd2+ adsorption.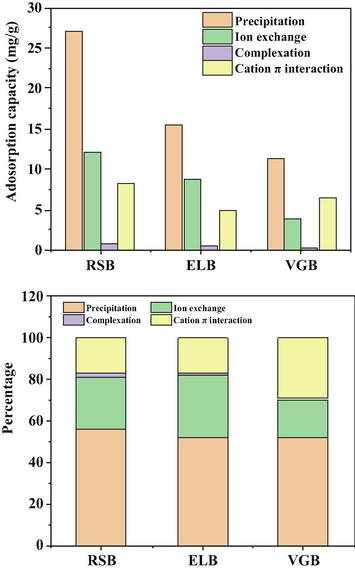
Relative contribution of four main mechanisms to the total Cd2+ adsorption by the three biochars.
3.3.2 Ion exchange
Cd2+ could exchange with K+, Na+, Ca2+, Mg2+ within biochar through electrostatic attraction of its negative charge, complexation with hydroxyl and carboxyl and precipitation of MgCO3 and CaSO4 in the ash, which were released into aqueous solution as a result (Deng et al., 2020). This was confirmed by EDS spectra, in which the contents of K+, Na+, Ca2+, Mg2+ obviously changed in the three biochar after adsorption (Fig. 1). By calculating the net release amount of the four cations, the adsorption capacity of Cd2+ by ion exchange of the three biochars could be quantitatively measured (Table S4). The experimental results showed that ion exchange accounted for 25.20% (RSB), 29.71% (ELB), 17.88% (VGB) of their total adsorption capacity.
3.3.3 Complexation
XPS and FTIR were conducted to characterize the changes of functional groups of the three biochars before and after adsorption. In the XPS spectra, the binding energy of Cd3d appeared in the three biochars, demonstrating that Cd2+ had been successfully adsorbed (Fig. S1). In the C1s spectra (Fig. 6), the ratio of C—O (285.95 eV) of RSB decreased from 62.54% to 44.14%, while that of C⚌O (286.94 eV) increased from 15.34% to 37.67% (J. Wu et al., 2021). The ratio of C⚌O (286.52 eV) of ELB decreased from 76.50% to 63.23%. The C—O (285.78 eV) of VGB disappeared after adsorption, and the ratio of C⚌O (286.18 eV) decreased from 34.91% to 18.56% (M. Li et al., 2019). In the O1s spectra (Fig. 7), at least one peak in each biochar disappeared after adsorption, with the ratios of the remaining peaks changed significantly. These indicated that OFGs of the three biochars participated in the adsorption by all the biochar. In the FTIR spectra (Fig. 5B), the peaks at 3386 cm−1 (RSB), 3348 cm−1 (ELB), 3389 cm−1 (VGB) represented O—H stretching vibration (Wu et al., 2019). The peaks at 1611 cm−1 (RSB), 1580 cm−1 (ELB), 1598 cm−1 (VGB) were attributed to either the C⚌C structures in aromatic groups or the C⚌O stretching vibration of carboxyl (Cui et al., 2016b). Those peaks shifted after adsorbing Cd2+, suggesting that hydroxyl and carboxyl of the three biochars may participate in complexation reaction. Nevertheless, the FTIR spectrum of the three biochars did not obviously change, which meant that the complexation may not play an important part in the adsorption process.
Previous work demonstrated that organic functional groups of biochar involved in adsorbing Cd2+ mainly included carboxyl and hydroxyl, which would release H+ after complexing with Cd2+, leading to a decrease in the pH of Cd2+ solution (Lu et al., 2012). Thus, the contribution of complexation could be calculated by the net release amount of H+ of the demineralized biochars before and after adsorption (Table S5). The results showed the contribution ratios were 1.85% (RSB), 1.36% (ELB), 0.27% (VGB), respectively, which further verified that the contribution of complexation to the total adsorption capacity in the three biochars was very small. In addition, this result also accorded with their corresponding rates of O/C and H/C.
3.3.4 Cd-π interaction
The aromatic structures in biochar such as —CH, C⚌C etc. could coordinate with cations by providing π electron (Li et al., 2017). As seen in the FTIR spectrum (Fig. 5B), in addition to the shift of C⚌C peaks mentioned above, the peaks at 2925 cm−1 (RSB), 2923 cm−1, 2930 cm−1 (VGB) belonging to the —CH structures in aromatic groups shifted after adsorption, indicating that cation π interaction between biochar and Cd2+ occurred (Peng et al., 2017). This was further confirmed by XPS spectra of C1s, where the ratio of C⚌C at the binding energy of 284.8 eV changed obviously in the three biochars after adsorption. The relative contribution of cation π interaction could be obtained by subtracting the adsorption contribution of the above three mechanisms from total adsorption capacity, with the results being 17.01% (RSB), 16.68% (ELB), 29.43% (VGB), respectively.
4 Conclusions
This study compared the Cd2+ adsorption characteristics and mechanisms of biochars derived from three different plant-based biomass. The results showed that the order of adsorption capacity was RSB > ELB > VGB. The optimal initial pH of Cd2+ solution for adsorption was 6 (RSB, VGB) and 5 (ELB), respectively. Kinetics studies showed that the adsorption behavior of the three biochars could be well fitted by pseudo-second-order and Elovich model, indicating that the adsorption was heterogeneously chemical adsorption. Isotherm experiments suggested that Freundlich fitted better for the three biochars than Langmuir, revealing that the adsorption was multilayer. Maximum adsorption capacity calculated by Langmuir model was 57.87 mg/g (RSB), 50.21 mg/g (ELB), 44.09 mg/g (VGB), respectively. The quantitative analysis of four main mechanisms revealed that Cd2+ adsorption by the three biochar was dominated by precipitation, ion exchange, and cation π interaction, while complexation had negligible contribution to total adsorption capacity. Thus, the preparation of engineered biochar to enhance the adsorption capacity of Cd2+ by the complexation may be conducive to plant-based biochars playing a greater role in the treatment of wastewater contaminated by Cd2+.
Acknowledgements
This research was financially supported by Basic and Applied Research Program of Guangdong Province (2019A1515012187), and Key Laboratory of Water and Air Pollution Control of Guangdong Province (2017A030314001).
Declaration of Competing Interest
The authors declare that they have no known competing financial interests or personal relationships that could have appeared to influence the work reported in this paper.
References
- Biochar as a sorbent for contaminant management in soil and water: A review. Chemosphere. 2014;99:19-33.
- [CrossRef] [Google Scholar]
- Silicate-modified oiltea camellia shell-derived biochar: A novel and cost-effective sorbent for cadmium removal. J. Cleaner Prod.. 2021;281:125390
- [CrossRef] [Google Scholar]
- A comparative study on biochar properties and Cd adsorption behavior under effects of ageing processes of leaching, acidification and oxidation. Environ. Pollut.. 2019;254:113123
- [CrossRef] [Google Scholar]
- The mechanism of cadmium sorption by sulphur-modified wheat straw biochar and its application cadmium-contaminated soil. Sci. Total Environ.. 2020;714:136550
- [CrossRef] [Google Scholar]
- Hydroxyapatite modified sludge-based biochar for the adsorption of Cu2+ and Cd2+: Adsorption behavior and mechanisms. Bioresour. Technol.. 2021;321:124413
- [CrossRef] [Google Scholar]
- Adsorption of Cd by peanut husks and peanut husk biochar from aqueous solutions. Ecol. Eng.. 2016;87:240-245.
- [CrossRef] [Google Scholar]
- Potential mechanisms of cadmium removal from aqueous solution by Canna indica derived biochar. Sci. Total Environ.. 2016;562:517-525.
- [CrossRef] [Google Scholar]
- Capacity and mechanisms of ammonium and cadmium sorption on different wetland-plant derived biochars. Sci. Total Environ.. 2016;539:566-575.
- [CrossRef] [Google Scholar]
- Competitive adsorption behaviour and mechanisms of cadmium, nickel and ammonium from aqueous solution by fresh and ageing rice straw biochars. Bioresour. Technol.. 2020;303:122853
- [CrossRef] [Google Scholar]
- Quantitative mechanisms of cadmium adsorption on rice straw- and swine manure-derived biochars. Environ. Sci. Pollut. Res.. 2018;25(32):32418-32432.
- [CrossRef] [Google Scholar]
- Removal of heavy metal ions from wastewaters: A review. J. Environ. Manage.. 2011;92(3):407-418.
- [CrossRef] [Google Scholar]
- Relative distribution of Cd2+ adsorption mechanisms on biochars derived from rice straw and sewage sludge. Bioresour. Technol.. 2019;272:114-122.
- [CrossRef] [Google Scholar]
- Synthesis of a novel ternary HA/Fe-Mn oxides-loaded biochar composite and its application in cadmium (II) and arsenic (V) adsorption. J. Environ. Sci.. 2019;85:168-176.
- [CrossRef] [Google Scholar]
- Current status, spatial features, health risks, and potential driving factors of soil heavy metal pollution in China at province level. Environ. Pollut.. 2020;266:114961
- [CrossRef] [Google Scholar]
- Quantitative contribution of Cd2+ adsorption mechanisms by chicken-manure-derived biochars. Environ. Sci. Pollut. Res.. 2018;25(28):28322-28334.
- [CrossRef] [Google Scholar]
- Qualitative and quantitative characterization of adsorption mechanisms for Cd2+ by silicon-rich biochar. Sci. Total Environ.. 2020;731:139163
- [CrossRef] [Google Scholar]
- Characterization of sludge generated by electrocoagulation for the removal of heavy metals. Desalin. Water Treat.. 2014;52(4–6):909-919.
- [CrossRef] [Google Scholar]
- Mechanisms of metal sorption by biochars: Biochar characteristics and modifications. Chemosphere. 2017;178:466-478.
- [CrossRef] [Google Scholar]
- Enhanced thallium (I) removal from wastewater using hypochlorite oxidation coupled with magnetite-based biochar adsorption. Sci. Total Environ.. 2020;698:134166
- [CrossRef] [Google Scholar]
- Sorption mechanisms of lead on silicon-rich biochar in aqueous solution: Spectroscopic investigation. Sci. Total Environ.. 2019;672:572-582.
- [CrossRef] [Google Scholar]
- EDTA functionalized magnetic biochar for Pb (II) removal: Adsorption performance, mechanism and SVM model prediction. Sep. Purif. Technol.. 2019;227:115696
- [CrossRef] [Google Scholar]
- Preparation and application of magnetic biochar in water treatment: A critical review. Sci. Total Environ.. 2020;711:134847
- [CrossRef] [Google Scholar]
- A lignin-biochar with high oxygen-containing groups for adsorbing lead ion prepared by simultaneous oxidization and carbonization. Bioresour. Technol.. 2020;307:123165
- [CrossRef] [Google Scholar]
- Utilization of biochar produced from invasive plant species to efficiently adsorb Cd (II) and Pb (II) Bioresour. Technol.. 2020;317:124011
- [CrossRef] [Google Scholar]
- Cadmium accumulation and physiological response of Amaranthus tricolor L. under soil and atmospheric stresses. Environ. Sci. Pollut. Res. 2020
- [CrossRef] [Google Scholar]
- Removal of cadmium in aqueous solution using wheat straw biochar: effect of minerals and mechanism. Environ. Sci. Pollut. Res.. 2018;25(9):8688-8700.
- [CrossRef] [Google Scholar]
- Relative distribution of Pb2+ sorption mechanisms by sludge-derived biochar. Water Res.. 2012;46(3):854-862.
- [CrossRef] [Google Scholar]
- Surface chemistry variations among a series of laboratory-produced biochars. Geoderma. 2011;163(3):247-255.
- [CrossRef] [Google Scholar]
- Competitive adsorption of heavy metals in aqueous solution onto biochar derived from anaerobically digested sludge. Chemosphere. 2019;219:351-357.
- [CrossRef] [Google Scholar]
- Enhanced adsorption of Cu (II) and Cd (II) by phosphoric acid-modified biochars. Environ. Pollut.. 2017;229:846-853.
- [CrossRef] [Google Scholar]
- Soil heavy metal pollution and food safety in China: Effects, sources and removing technology. Chemosphere. 2021;267:129205
- [CrossRef] [Google Scholar]
- Sui, F., Jiao, M., Kang, Y., Joseph, S., Li, L., Bian, R., Munroe, P., Mitchell, D.R.G., Pan, G., 2021. Investigating the cadmium adsorption capacities of crop straw biochars produced using various feedstocks and pyrolysis temperatures. Environ. Sci. Pollut. Res. https://doi.org/10.1007/s11356-020-11979-3.
- Application of biochar for the removal of pollutants from aqueous solutions. Chemosphere. 2015;125:70-85.
- [CrossRef] [Google Scholar]
- Amino-functionalized sewage sludge-derived biochar as sustainable efficient adsorbent for Cu (II) removal. Waste Manage.. 2019;90:17-28.
- [CrossRef] [Google Scholar]
- Efficient removal of Cd (II) from aqueous solution by pinecone biochar: Sorption performance and governing mechanisms. Environ. Pollut.. 2020;265:115001
- [CrossRef] [Google Scholar]
- High-efficiency removal capacities and quantitative adsorption mechanisms of Cd2+ by thermally modified biochars derived from different feedstocks. Chemosphere. 2021;272:129594
- [CrossRef] [Google Scholar]
- Preparation, modification and environmental application of biochar: A review. J. Cleaner Prod.. 2019;227:1002-1022.
- [CrossRef] [Google Scholar]
- Investigating the adsorption behavior and the relative distribution of Cd2+ sorption mechanisms on biochars by different feedstock. Bioresour. Technol.. 2018;261:265-271.
- [CrossRef] [Google Scholar]
- Biochar surface complexation and Ni (II), Cu (II), and Cd (II) adsorption in aqueous solutions depend on feedstock type. Sci. Total Environ.. 2020;712:136538
- [CrossRef] [Google Scholar]
- Investigating the mechanisms of biochar’s removal of lead from solution. Bioresour. Technol.. 2015;177:308-317.
- [CrossRef] [Google Scholar]
- Industrial alkali lignin-derived biochar as highly efficient and low-cost adsorption material for Pb (II) from aquatic environment. Bioresour. Technol.. 2021;322:124539
- [CrossRef] [Google Scholar]
- A novel modified method for the efficient removal of Pb and Cd from wastewater by biochar: Enhanced the ion exchange and precipitation capacity. Sci. Total Environ.. 2021;754:142150
- [CrossRef] [Google Scholar]
- The distribution of Pb (II)/Cd (II) adsorption mechanisms on biochars from aqueous solution: Considering the increased oxygen functional groups by HCl treatment. Bioresour. Technol.. 2019;291:121859
- [CrossRef] [Google Scholar]
- Enhanced adsorption of Cd (II) from aqueous solution by a magnesium oxide–rice husk biochar composite. Environ. Sci. Pollut. Res.. 2018;25(14):14032-14042.
- [CrossRef] [Google Scholar]
- Indispensable role of biochar-inherent mineral constituents in its environmental applications: A review. Bioresour. Technol.. 2017;241:887-899.
- [CrossRef] [Google Scholar]
- Pyrolysis of sewage sludge by electromagnetic induction: Biochar properties and application in adsorption removal of Pb (II), Cd (II) from aqueous solution. Waste Manage.. 2019;89:48-56.
- [CrossRef] [Google Scholar]
- A review of soil heavy metal pollution from industrial and agricultural regions in China: Pollution and risk assessment. Sci. Total Environ.. 2018;642:690-700.
- [CrossRef] [Google Scholar]
- Hierarchical porous biochar-based functional materials derived from biowaste for Pb (II) removal. Appl. Surf. Sci.. 2019;465:297-302.
- [CrossRef] [Google Scholar]
- Facile preparation of sulfonated biochar for highly efficient removal of toxic Pb (II) and Cd (II) from wastewater. Sci. Total Environ.. 2021;750:141545
- [CrossRef] [Google Scholar]
- N-doping effectively enhances the adsorption capacity of biochar for heavy metal ions from aqueous solution. Chemosphere. 2018;193:8-16.
- [CrossRef] [Google Scholar]
- Preparation of rice straw-derived biochar for efficient cadmium removal by modification of oxygen-containing functional groups. Sci. Total Environ.. 2018;631–632:795-802.
- [CrossRef] [Google Scholar]
- Mechanisms of Pb and/or Zn adsorption by different biochars: Biochar characteristics, stability, and binding energies. Sci. Total Environ.. 2020;717:136894
- [CrossRef] [Google Scholar]
- Novel wet pyrolysis providing simultaneous conversion and activation to produce surface-functionalized biochars for cadmium remediation. J. Cleaner Prod.. 2019;221:63-72.
- [CrossRef] [Google Scholar]
Appendix A
Supplementary material
Supplementary data to this article can be found online at https://doi.org/10.1016/j.arabjc.2021.103119.
Appendix A
Supplementary material
The following are the Supplementary data to this article:


