

Translate this page into:
Integrating metabolic characterization and pharmacokinetics to uncover the active compounds of Salvia miltiorrhiza-Ligusticum chuanxiong for treating cerebral ischemia
* Corresponding authors: E-mail addresses: hanqingpang@126.com (H. Pang), bcyan@yzu.edu.cn (B. Yan)
-
Received: ,
Accepted: ,
Abstract
Salvia miltiorrhiza (SM) and Ligusticum chuanxiong (LC) are a well-known herb pair, frequently used in China to treat cerebral ischemia. However, there has been no comprehensive analysis on the metabolic profile, active compounds, and pharmacokinetics of SM−LC. Hence, this work aimed to reveal the active ingredients of SM-LC by establishing its metabolic profile and muti-compound pharmacokinetics by analysis. The strategy integrated visual basic for applications (VBA)-based background removal with a modified mass defect filter (MMDF) technique for the metabolome profiling of SM-LC. A total of 154 exogenous (33 prototypes and 121 metabolites) compounds were quickly characterized in vivo. The predominant metabolic pathways of SM-LC included phase I reactions (methylation, oxidation, hydrogenation, dehydration and hydroxylation, etc.) and phase II reactions (acetylation, glucuronidation and glycosylation, etc.). Then the validated ultra-high performance liquid chromatography connected with tandem triple quadrupole mass spectrometry was employed for the plasma pharmacokinetic analysis of 16 prototypes from SM-LC. Compared with the individual herbs, SM-LC could enhance the Cmax and area under the curve (AUC) of danshensu, lithospermic acid, senkyunolide I, butylidenephthalide, tanshinone IIA (P < 0.05). Moreover, neuroprotective activity evaluation indicated that phenolic acids were good at protecting BEND.3 cells from oxygen glucose deprivation/reperfusion (OGD/R) injury, while phthalides and tanshinones exerted obvious neuroprotective effects on HT22 and BV2 cells under the OGD/R injury model. This study would enhance the understanding of the biotransformation profiles and active ingredients of SM-LC against cerebral ischemia, thereby promoting the clinical application of related prescriptions.
Keywords
Active compounds
Ligusticum chuanxiong
Metabolome characterization
Pharmacokinetics
Salvia miltiorrhiza

1. Introduction
Herb pairs, consisting of two herbs commonly used in herbal medicines (HMs) prescriptions, are the fundamental constituent units of HMs prescriptions [1]. Salvia miltiorrhiza (SM), sourced from the rhizomes and roots of Salvia miltiorrhiza Bunge, is effective in circulating blood, nourishing blood, and tranquilizing the mind [2]. Ligusticum chuanxiong (LC), derived from the rhizomes of Ligusticum chuanxiong Hort, is known for its ability to invigorate Qi, relieve pain, circulate blood, and dispel wind [3]. SM and LC have been used in HM formulae for centuries as fundamental components in the treatment of ischemic diseases [4]. Despite the several pharmacological, phytochemical, and network pharmacology studies of SM-LC performed [5,6], there are only a few reports on its in vivo metabolism. Nowadays, only one research has been conducted on the plasma pharmacokinetics (only four phenolic acids) of SM-LC [7], and no report on metabolic profiling is available. Therefore, it is significant to perform the absorption and metabolism studies on the global compounds in SM-LC.
Comprehensive metabolites profiling and pharmacokinetics studies have become an effective tool for the discovery of active ingredients in HM formulae [8]. Our recent work indicated that SM-LC possessed synergistic effects in middle cerebral artery occlusion/reperfusion (MCAO/R) mice, and 83 compounds were characterized in this herb pair [4]. However, the active ingredients of SM-LC for treating cerebral ischemia were still not well understood. Some reports indicated that the expression levels of metabolic enzymes and transcription factors varied between normal and pathological conditions [9,10]. Hence, the pathological condition could alter the in vivo behaviors of HMs. To elucidate the active ingredients of SM-LC, it is essential to conduct a global metabolite characterization and pharmacokinetic analysis in pathological states.
Currently, ultra-high performance liquid chromatography (UHPLC) combined with high-resolution mass spectrometry (HRMS) is the widely adopted method for the chemical profiling of HMs [11]. Nevertheless, the complexity of MS data brought great challenges in quickly assigning prototypes and metabolic compounds because of the interfering ions [12]. Recently, several post-acquisition data processing technologies (neutral losses (NLs) and modified mass defect filtering (MMDF) etc.) have been applied for rapid chemical characterization of HMs [13,14]. The MMDF technique could categorize the xenobiotic ions into different chemical structures based on their mass defect values [15]. Moreover, pharmacokinetic researches on the active compounds of HMs are essential for drug development [16]. UHPLC connected with tandem triple quadrupole mass spectrometry (UHPLC-QQQ-MS), has become the mature approach to pharmacokinetic studies. By integrating the metabolic characterization and pharmacokinetics analysis, the active compounds of SM-LC for treating cerebral ischemia could be discovered.
This study established a method using UHPLC combined with quadrupole time-of-flight mass spectrometry (UHPLC-QTOF-MS), along with background removal and MMDF techniques, to identify the prototypes and metabolites in the plasma and brain of the middle cerebral artery occlusion/reperfusion (MCAO/R) rats after oral administration of SM-LC. Afterward, the UHPLC-QQQ-MS approach was performed for the comparative pharmacokinetic analysis of the active compounds of SM-LC in the plasma of MCAO/R rats. HT22, BEND.3, and BV2 cells were the major cell types in the brain, which played significant roles in repairing brain function after cerebral ischemia [17]. Hence, the neuroprotective activities of the potential active compounds were also evaluated on oxygen-glucose deprivation/reoxygenation (OGD/R) induced HT22, BEND.3, and BV2 cell injury models. Our findings would contribute to clarifying the active compounds of SM-LC against cerebral ischemia.
2. Materials and Methods
2.1. Chemicals and reagents
SM and LC were both provided by Affiliated Hospital of Yangzhou University, and validated by Prof. Han-Qing Pang (Department of Pharmacognosy, Medical college, Yangzhou University). Sixteen chemical references, including danshensu, ferulic acid, caffeic acid, rosmarinic acid, lithospermic acid, salvianolic acid B, salvianolic acid A, ligustilide, senkyunolide A, senkyunolide I, 3-n-butylphathlide, levistilide A, butylidenephthalide, dihydrotanshinone I, tanshinone IIA, and crytotanshinone, were supplied by the Chengdu Must Biological Technology Co. Ltd. (Chengdu, China). Internal standards (ketoprofen and phenformin) were purchased from Shanghai Yuanye Biological Technology Co. Ltd. (Shanghai, China). Their purities were above 98%. high performance liquid chromatography (HPLC)-grade formic acid, methanol, and acetonitrile were supplied by Merck KGaA (Darmstadt, Germany). Milli-Q purification equipment (Millipore, MA, USA) was employed to prepare ultrapure water. Other used chemicals were analytical grades.
2.2. Preparation of SM-LC extracts
As the tanshinones in SM were insoluble in the water decoction [18], both ethanol and water extracts of SM-LC were utilized. The weighted SM-LC, SM, and LC were refluxed two times with water (1/10, w/v) and 95% ethanol (1:10, w/v) for 1.5 hrs and 1 hr, separately. Then the combined filtrates were concentrated to 2 g of crude drug per mL. The prepared herb extract was stored at −80°C until use.
2.3. Metabolic profiling research
2.3.1. Animals
Sprague–Dawley (SD) male rats (220−250 g) were purchased from Jiangsu Qinglongshan Biotechnology Co., Ltd. (Nanjing, China). The Animal Ethics Committee of Yangzhou University gave permission to perform the animal experiment (Approval No. YXYLL-2023-08). These rats were housed for one week under a controlled light-dark cycle. Afterward, the rats were categorized into three groups randomly: the control sample group (n = 3), the brain sample group (n = 15, 3 per time point), and the plasma sample group (n = 3). Rats were administrated via gavage with SM-LC (8.1 g/kg, two-fold of the human clinical dosage) once a day for four continuous days.
2.3.2. Instruments and parameters
The metabolites identification was performed on Waters ACQUITY UHPLC (Waters Corp., Milford, USA) combined with AB SCIEX Triple TOF 4600 mass spectrometer (AB SCIEX Corp., Massachusetts, USA). A Zorbax Eclipse Plus C18 (100 × 2.1 mm, 1.7 µm) column was applied for the chromatographic separation. Column temperature was kept at 35°C. For the characterization of plasma metabolites, a gradient program including solvent A (acetonitrile) and solvent B (aqueous solution containing 0.1% formic acid) was as follows: 0 − 1.5 min, 5% − 6% A; 1.5 − 6.5 mins, 6% − 17% A; 6.5 − 14 mins, 17% − 29% A; 14 − 28 mins, 29% − 95% A; 28 − 30 mins, 95% − 95% A. To identify brain metabolites, the gradient elution program of acetonitrile (solvent A) and water containing 0.1% formic acid (solvent B) was as bellows: 0 − 3.5 mins, 5% − 5% A; 3.5 − 12 mins, 22% − 52% A; 12 − 28 mins, 52% − 95% A; 28 − 30 mins, 95% − 95% A. Injection volume and flow rate were 2 µL and 0.35 mL/min, accordingly. AB SCIEX TripleTOF 4600 was utilized to acquire mass data. The mass parameters included the following: collision energy scope (CES), ±15 V; curtain gas (CUR), 35 psi; mass range 50−1200 Da; collision energy (CE), ±35 V; auxiliary gas (GS2), 50 psi; ion source temperature (TEM), 500°C; nebulizer pressure (GS1), 50 psi; ion spray voltage floating (ISVF), +5000 V/ −4500 V.
2.3.3. Sample collection
Blood samples from ophthalmic venous plexus were collected at 0, 0.25, 0.5, 1, 2, 4, 6, 8, and 12 hrs after the final administration. To prepare plasma samples, blood kept in anticoagulant-treated centrifuge tubes was centrifuged at 4000 rpm (4°C) for 15 mins.
After the final administration of SM-LC, brain samples were obtained at multiple time points (0, 0.5, 1, 2, and 4 hrs). Then, the brain was rapidly rinsed using physiological saline to wash the blood, and absorbent paper was used to dry the samples. These plasma and brain samples were kept at −80°C till the UHPLC-QTOF-MS analysis was done.
2.3.4. Biological sample treatment
To minimize individual variability, plasma samples (50 µL each) collected at various time points were combined into a single sample for the characterization of parent compounds and metabolites. Using three times the volume of methanol, 300 µL of the mixed plasma samples were used to precipitate proteins. The processed samples were vortex-mixed for 3 mins, and centrifuged at 13,000 rpm/min for 15 mins (4°C), the supernatant was collected and dried using nitrogen-blow. The residues were re-dissolved in 120 µL of water−acetonitrile (70:30, v/v). After centrifugation at 13,000 rpm/min for 15 mins (4°C), 100 µL of the supernatant was obtained for the identification of plasma metabolites.
To prepare the brain homogenate, the pre-cooled physiological saline (1:5, w/v) was added to the brain samples. Subsequently, 300 µL of the mixed brain homogenate was mixed with 900 µL of methanol. The mixed brain homogenate was vortex-mixed for 3 mins and centrifugated at 13,000 rpm/min for 15 mins (4°C). The supernatant was evaporated to dryness using nitrogen gas. The residues were redissolved in 200 µL of acetonitrile−water (30:70, v/v). The supernatant was acquired for identification analysis after centrifugation for 15 mins (4°C) at 13,000 rpm/min.
2.3.5. Analytical strategy
The metabolic profiling strategy has been shown in Figure 1. The detailed identification process was composed of four parts. First, according to the set threshold of IDA Explorer (PeakView Software Version, 1.2), the accurate mass and retention time of different samples (blank control plasma and brain, drug-containing plasma as well as drug-containing brain) were exported into the Excel file. To acquire as many ions as possible, the intensities of detected peaks above 1000 were chosen for further characterization. The quality scores of compounds should be higher than 20, and the retention time was set as 1−30 mins. Secondly, a VBA program embedded in Excel was established to eliminate the common ions retrieved from both blank control and drug-containing sample. Thirdly, the potential exogenous ions were further identified by the MMDF technique. The detailed MMDF information based on the structure templates for phenolic acids, phthalides, and tanshinones will be elucidated in the following sections. At last, the comprehensive strategy of VBA-based background removal and MMDF technique was applied for the in vivo metabolic profiling of SM-LC. Compared to the published reports [13,14], the established analytical strategy had the following advantages: (1) the xenobiotic ions could be extracted from the massive mass data using a VBA-based background removal technique; (2) the xenobiotic ions could be further classified into the phenolic acids-, phthalides-, and tanshinones-related metabolites under the assistance of MMDF strategy; (3) the phenolic acids-, phthalides-, and tanshinones-related metabolites could be quickly identified by database querying.

- The schematic diagram of the metabolome profiling strategy.
2.4. Pharmacokinetic studies
2.4.1. Instruments and parameters
The pharmacokinetic analysis was conducted using Waters ACQUITY UHPLC equipment connected to SCIEX 4500 QQQ-MS. Electrospray source ionization (ESI) was utilized, and the data was processed using the MultiQuant™ software. Chromatographic analysis was conducted on the ZORBAX Eclipse Plus C18 (100 × 2.1 mm, 1.7 µm) column at 40°C. The mobile phase consisted of solvent A (0.1% formic acid aqueous solution) and solvent B (acetonitrile), which was programmed according to the following gradient: 0 − 1.5 mins, 5% − 10% B; 1.5 − 8.5 mins, 10% − 48% B; 8.5 − 12.5 mins, 48% − 95% B; 12.5 − 15 mins, 95%−95% B. Injection volume and flow rate were set at 2 µL and 0.3 mL/min, respectively.
The mass parameters were configured as follows: nebulizer gas, 25 psi; turbine gas, 25 psi; curtain gas, 20 psi; capillary voltage, 4500 V; source temperature, 450°C. The optimal MRM conditions for target compounds have been summarized in Table S1. The structures of analytes have been illustrated in Figure S1.
2.4.2. Administration and sample collection
Sprague Dawley (SD) rats were randomly categorized into the following groups: LC (n = 8), SM (n = 8), SM-LC (n = 8). LC, SM, and SM-LC groups were administered intragastrically with 2.7 g/kg of LC, 5.4 g/kg of SM, and 8.1 g/kg of SM-LC extract, respectively.
Blood from the venous vein was collected at 0, 0.083, 0.25, 0.33, 0.5, 0.75, 1, 2, 3, 4, 6, 9, 12, and 24 hrs. About 0.35 mL of blood sample was obtained and kept in 1.5 mL centrifuge tubes. The blood samples were centrifuged at 4000 rpm/min (4°C) for 15 mins, and 100 µL of supernatant was added to a new tube. All obtained samples were kept at −80°C until the pharmacokinetic analysis.
2.4.3. Plasma sample preparation
Plasma samples were thawed at room temperature. 50 µL of IS solution containing phenformin (1.02 µg/mL) and ketoprofen (2.06 μg/mL), 100 µL of plasma, and 300 µL of methanol were vortexed for 2 mins. Subsequently, the mixed samples were centrifugated at 13,000 rpm/min for 15 mins (4°C), and the supernatant was dried under nitrogen gas. Residues were dissolved in 100 µL of water−acetonitrile (70:30, v/v), vortex-mixed for 3 mins, and centrifuged for another 10 mins (13,000 rpm/min, 4°C). The samples were then determined by UHPLC-QQQ-MS.
2.4.4. Preparation of standards solutions and QC samples
Precisely weighted phenformin (IS), ketoprofen (IS), salvianolic acid B, chlorogenic acid, danshensu, 3-n-butylphathlide, rosmarinic acid, tanshinone IIA, caffeic acid, salvianolic acid A, senkyunolide A, ferulic acid, lithospermic acid, ligustilide, senkyunolide I, crytotanshinone, butylidenephthalide, and dihydrotanshinone I were dissolved in methanol as standard stock solutions. A series of different concentrations of standard working solutions (except for IS) were mixed and processed by diluting the stock standard solutions with methanol. Certain amounts of the IS stock solutions were prepared using methanol to acquire the IS working solution (9.0 µg/mL of phenformin, 7.2 µg/mL of ketoprofen). Four levels (high, medium, low, and lower limit of quantification (LLOQ)) of quality control (QC) samples were prepared using the same steps as the preparation of standard solutions. All samples were stored at −20°C before pharmacokinetic analysis.
2.4.5. Method validation
2.4.5.1. Selectivity
Plasma samples from the SM-LC group were compared with control plasma, and the control plasma was added with the 16 analytes and internal standards (IS) for the evaluation of selectivity.
2.4.5.2. Linearity and LLOQ
Calibration curves were determined by analyzing the standard working solutions at multiple levels. Peak area ratios of the 16 analytes to IS (y), as well as their theoretical concentrations (x) were plotted as calibration curves and processed by weighted (1/x2) linear regression. LLOQ was measured as the lowest amount of analyte that could be quantified with acceptable accuracy and precision.
2.4.5.3. Precision and accuracy
Accuracy, along with inter- and intra-day precision, were measured by quantifying three QC samples (n = 5) at high, low, and medium concentrations over three consecutive days and on the same day. Relative error (RE) and relative standard deviation (RSD) were utilized to determine accuracy and precision, respectively.
2.4.5.4. Stability
The stability of 16 analytes was assessed by determining the QC samples with multiple levels (n = 5) under the following conditions: −80°C for 30 days, post-preparation at 4°C for 12 hrs, and three freeze-thaw cycles, room temperature for 4 hrs.
2.4.5.5. Extraction recovery and matrix effect
Extraction recovery was assessed by comparing the peak areas of post-extracted control plasma added with 16 active ingredients and extracted QC samples at three identical concentrations. The matrix effects were conducted by comparing the peak area ratios of target analytes to IS between the post-extraction sample solutions and standard solutions at the same levels.
2.5. Neuroprotective activity evaluation in vitro
2.5.1. Preparation of sample solutions
Sixteen prototypes were accurately weighed and dissolved in dimethyl sulfoxide (DMSO) as the stock solutions. The stock solutions were diluted to various concentrations of working solutions with serum-free medium (containing 0.1% DMSO).
2.5.2. Construction of nerve cell injury model and drug administration
Neurons, microglia, and cerebral vascular endothelial cells are the main types of brain cells. Therefore, HT22, BEND.3, and BV2 cell-injury models were used to evaluate the neuroprotective effects of 16 prototypes. Logarithmic phase HT22 cells (2 × 10⁵ cells/well), BEND.3 cells (3 × 10⁵ cells/well), and BV2 cells (2 × 10⁵ cells/well) were seeded into 96-well plates for 24 hrs. After three washes in Earle’s balanced salt solution, HT22, BEND.3, and BV2 cells were subjected to OGD conditions (94% N2, 1% O2, and 5% CO2) for 6, 7, and 2 hrs, respectively. Then, these cells were reoxygenated with a complete medium containing five concentrations of the chemicals for 24 hrs. Cells cultured in a complete medium without the OGD/R process served as the control group. The cell viability of all groups was measured using a CCK-8 solution according to the manufacturer’s instructions.
3. Results and Discussion
3.1. VBA-based background subtraction program
Two datasets of blank biological samples and drug-treated samples were imported into two Excel files, then background removal was performed using a VBA program embedded in Microsoft Office. The total ion chromatograms were converted into total ion information, which included the variables of accurate mass and retention time. The total ions in the drug-treated biological samples could be filtered to screen the exogenous ions when the background removal was performed. This was obtained by filtering out the shared ions listed in both metabolite and blank control Excel files with a retention time shift window of 0.1 min and a mass error tolerance of 0.02 Da. The detailed program has been exhibited below:
|
Sub test() a = Sheet1.[A10000].End(3).Row b = Sheet2.[A 10000].End(3).Row arr = Sheet1.Range(“al:d” & a) brr = Sheet2.Range(“al:d” & b) Sheet1.Range(“al:d” & a).ClearContents Sheet2.Range(“al:d” & b).ClearContents For n = 2 To a For r = 2 To b If Abs(arr(n, 2) - brr(r, 2)) < 0.1 And Abs(arr(n, 3) - brr(r, 3)) < 0.02 Then arr(n, 4) = r: brr(r, 4) = n End If Next Next Sheet1.[Al].Resize(a, 4) = arr Sheet2.[Al].Resize(b, 4) = brr End Sub |
For every ion determined in the metabolites file, the established VBA program searched the target ion in the control file. If the target ion was found in the control file within the specified retention time and mass tolerance windows, this ion would be further imported into another file. Here, the background subtraction of SM-LC has been used as an illustrative example. As exhibited in Figure S1, the exact mass of the detected ions was separated by the integral mass and decimal mass as the horizontal and vertical coordinates, accordingly. The ions from plasma samples in drug-treated biological samples have been presented in Figure S1(a), and exogenous ions by removing endogenous interferences have been shown in Figure S1(b). By using the established VBA program, the metabolic ions with low abundance could be easily discovered during inspection.
3.2. Establishment of MMDF data mining for SM-LC related metabolites
In our recent work, 83 compounds (46 phenolic acids, 15 phthalides, 14 tanshinones, and 8 others) of SM-LC were identified [4]. To establish the MMDF windows, 46 phenolic acids, 15 phthalides, and 14 tanshinones were defined as essential candidate ingredients after eliminating the isomers. Then, according to the existing metabolic reactions, the mass-defect windows based on chemical structures (phenolic acids, phthalides, and tanshinones) were built (Table S2). Taking phenolic acids as an instance, the integral m/z of 46 phenolic acids ranged between 137 and 879 Da, and their decimal m/z was in the range of 24.4−207.1 mDa [4]. Based on references, 47 biochemical reactions of the phenolic acids could be produced, such as hydroxylation, deoxidation, methylation, and glucuronide conjugation [19,20]. Subsequently, the compound list containing 1002 predicted metabolic compounds was obtained, and the decimal (y) and integral (x) parts of theoretical m/z of predicted compounds were mapped onto the scatterplot (Figure 2a). The outermost data points could be discovered (Table S3) and connected to generate the MMDF window. Furthermore, in view of the possible errors (y ± 5 mDa, x ± 1 Da) [21], the newly established MMDF window could be connected through connecting the newly identified data points (Figure 2b). According to the VBA-based background subtraction program, 2801 potential SM-LC related ions were screened by background subtraction (Figure 2c). Finally, 1379 potential phenolic acids related ions were further discovered by polygonal MMDF (Figure 2d). Similarly, MMDF windows of phthalides (Figure S2) and tanshinones (Figure S3) were constructed. Finally, 1002, 217, and 252 phenolic acid-, phthalide-, and tanshinone-related metabolites were found, which would contribute to the identification of metabolites from SM-LC.
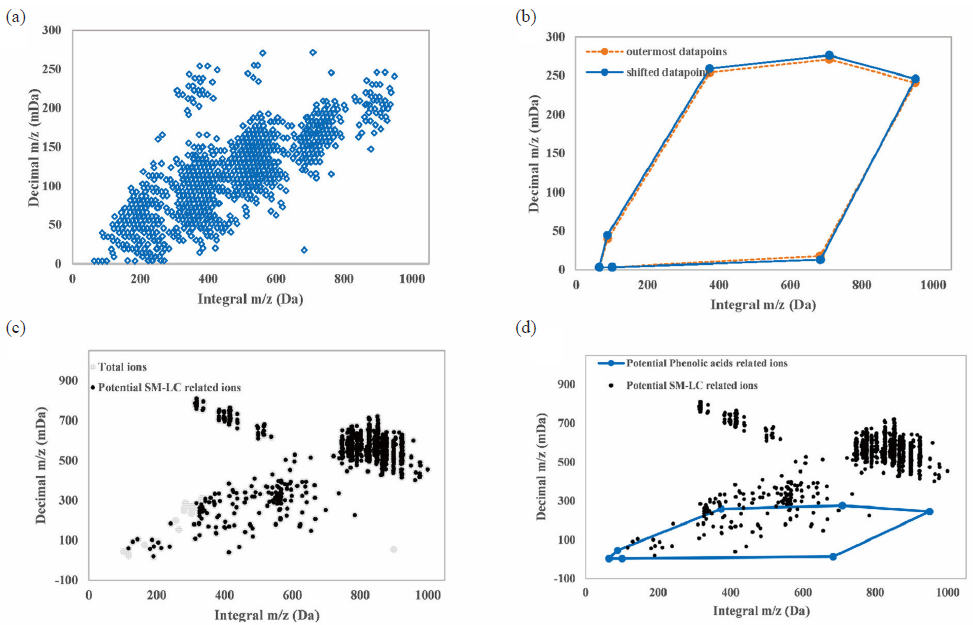
- The screening of potential phenolic acids in biological samples by polygonal MMDF. (a) Scatter diagram of predicted metabolites of phenolic acids. (b) Construction of original MMDF windows connected by seven outermost data points (dotted line) and final MMDF window connected by shifted data points (full line). (c) 2801 potential SM-LC-related ions screened by background subtraction. (d) 1379 potential phenolic acids related ions screened by polygonal MMDF. MMDF: Modified moving distance function, SM-LC: Salvia miltiorrhiza-ligusticum chuanxiong.
3.3. MMDF combined VBA-based background removal for rapid identifying SM-LC related metabolites
The UHPLC-QTOF-MS total ion chromatograms of various groups have been shown in Figure S4. Using the MMDF combined with VBA-based background subtraction techniques, a total of 154 compounds, including 140 (33 prototypes and 107 related metabolites) found in plasma and 45 (16 prototypes and 29 related metabolites) found in the brain were identified in MCAO/R rats. The essential metabolic process of the phenolic acids (Figure 3a), tanshinones (Figure 3b), and phthalides (Figure 3c) were discovered, and MS fragmentation information of the identified compounds has been summarized in Table 1. In our previous work, 111 exogenous ingredients originated from SM-LC, including 82 metabolites and 29 prototypes, were characterized from biological samples of normal rats [22]. Compared to the metabolite profiles of SM-LC in normal rats, more metabolites were discovered in MCAO/R rats, indicating that the metabolic enzymes were activated under pathological conditions. Furthermore, the leading metabolic pathways of SM-LC in normal rats were hydroxylation, deoxidation, decarboxylation, dihydroxylation, and glucuronidation binding metabolic reactions [22]; while the major metabolic patterns of SM-LC in MCAO/R rats were deoxidation, di-hydroxylation, hydrogenation, hydroxylation, and glucuronidation binding metabolic reactions (Figure 3).
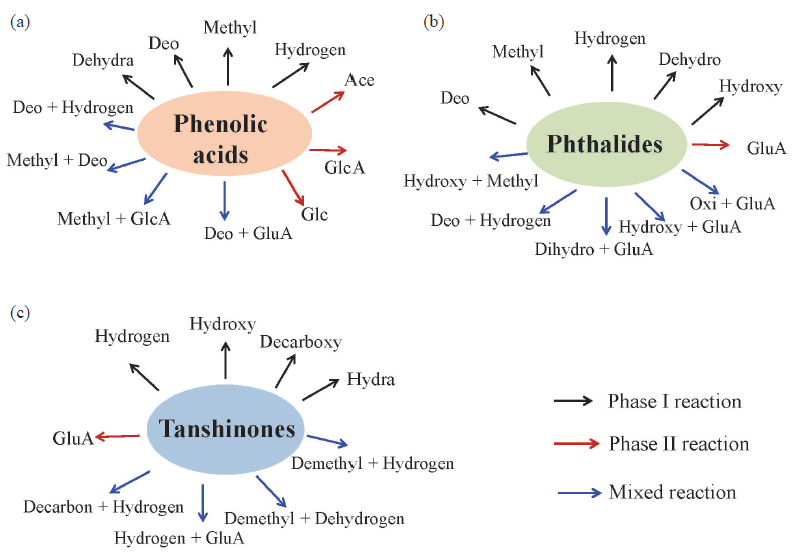
- Metabolic pathways of (a) phenolic acids, (b) phthalides and (c) tanshinones in SM-LC (GlcA: glucuronidation; Glc: glucosidation; Decarboxy: decarbonylation; Methyl: methylation; Hydroxy: hydroxylation; Demethyl: demethylation; Hydrogen: hydrogenation; Hydroly: hydrolysis; Dihydroxy: dihydroxylation; Deo: deoxidation; Dehydro: dehydrogenation; Hydra: hydration).
| Peak No. | tR (min) | Formula | Observed m/z | Error (ppm) | Adducts | Fragment ions (-) | Metabolic reactions | Metabolic pathway | P | B |
|---|---|---|---|---|---|---|---|---|---|---|
| A1 | 2.15 | C9H10O5 | 197.0466 | 5.3 | −H | 179.03, 161.00, 135.05, 123.04 | Danshensu* | − | ü | ü |
| M1-1 | 1.27 | C15H18O11 | 373.0788 | 3.1 | −H | 197.05, 179.03, 161.06, 147.03 | Glucuronidation of A1 | A1 + C6H8O6 | ü | |
| M1-2 | 2.92 | C9H10O4 | 181.0515 | 4.8 | −H | 147.03, 123.03, 117.01, 103.01 | Deoxidation of A1 | A1 − O | ü | |
| M1-3 | 4.76 | C9H10O3 | 165.0561 | 2.3 | −H | 147.03, 123.03, 117.01, 103.01 | Di-deoxidation of A1 | A1 − 2O | ü | |
| M1-4 | 5.68 | C15H18O10 | 357.0844 | 4.7 | −H | 341.07, 197.03, 179.05, 161.02 | Deoxidation + Glucuronidation of A1 | A1 + C6H8O6 − O | ü | |
| M1-5 | 6.35 | C10H12O4 | 195.0676 | 6.8 | −H | 161.00, 135.06, 123.05, 103.02 | Deoxidation + Methylation of A1 | A1 + CH2 − O | ü | |
| M1-6 | 6.76 | C13H16O6 | 267.0886 | 4.4 | −H | 197.04, 179.03, 161.04, 136.01 | Di-methylation + Acetylation of A1 | A1 + 2CH2 + OC2H2 | ü | |
| A2 | 4.72 | C8H8O4 | 167.0358 | 4.9 | −H | 123.04, 79.06 | Vanillic acid | − | ü | |
| M2-1 | 3.06 | C14H16O10 | 343.0686 | 4.5 | −H | 167.03, 157.01, 123.05 | Glucuronidation of A2 | A2 + C6H8O6 | ü | |
| A3 | 4.84 | C16H18O9 | 353.0973 | 5.9 | −H | 177.09, 163.03, 113.02, | Chlorogenic acid | − | ü | |
| M3-1 | 6.17 | C16H16O9 | 351.0721 | -0.2 | −H | 283.09, 179.01, 135.03 | Dehydrogenation of A3 | A3 − H2 | ü | |
| M3-2 | 8.54 | C18H22O9 | 381.1228 | 6.1 | −H | 163.03, 151.02, 113.05 | Di-methylation of A3 | A3 + 2CH2 | ü | |
| A4 | 5.54 | C9H8O4 | 179.0361 | 6.2 | −H | 135.06, 117.03, 107.05, 79.03 | Caffeic acid* | − | ü | |
| M4-1 | 4.04 | C15H16O10 | 355.0691 | 5.7 | −H | 311.08, 179.03, 135.04, 113.03 | Glucuronidation of A4 | A4 + C6H8O6 | ü | |
| M4-2 | 4.52 | C15H16O9 | 339.074 | 5.4 | −H | 179.03, 163.04, 93.05 | Deoxidation + Glucuronidation of A4 | A4 + C6H8O6 − O | ü | |
| M4-3 | 4.68 | C15H18O9 | 341.0890 | 4.1 | −H | 279.09, 179.03, 165.05, 113.02 | Glucosidation of A4 | A4 + C6H10O5 | ü | |
| M4-4 | 4.94 | C16H18O10 | 369.0832 | 1.3 | −H | 193.05, 178.02, 175.02, 134.03 | Methylation + Glucuronidation of A4 | A4 +C6H8O6 + CH2 | ü | |
| M4-5 | 7.13 | C9H8O3 | 163.0404 | 2.0 | −H | 146.01, 135.01, 119.05, 93.04 | Deoxidation of A4 | A4 − O | ü | |
| M4-6 | 12.48 | C12H14O4 | 221.0828 | 3.9 | −H | 179.03, 135.01, 93.04 | Tri-methylation of A4 | A4 + C3H6 | ü | |
| A5 | 6.88 | C10H10O4 | 193.0512 | 2.9 | −H | 178.02, 163.06, 147.01, 134.04 | Ferulic acid* | − | ü | |
| M5-1 | 3.71 | C16H18O10 | 369.0825 | -0.6 | −H | 193.04, 178.02, 134.04, 117.02 | Glucuronidation of A5 | A5 + C6H8O6 | ü | |
| M5-2 | 4.04 | C10H12O5 | 211.0621 | 4.3 | −H | 193.06, 165.06, 150.03, 121.03 | Hydration of A5 | A5 + H2O | ü | |
| M5-3 | 7.20 | C18H22O10 | 397.1141 | 0.2 | −H | 317.10, 221.08, 177.09, 113.02 | Di-methylation + Glucuronidation of A5 | A5 + C8H12O6 | ü | |
| M5-4 | 10.44 | C12H14O5 | 237.0779 | 4.4 | −H | 193.08, 150.04, 136.02, 108.02 | Hydrogenation + Acetylation of A5 | A5 + OC2H2 + H2 | ü | |
| M5-5 | 11.15 | C12H12O5 | 235.0628 | 6.8 | −H | 193.02, 163.07, 147.02, 121.03 | Acetylation of A5 | A5 + OC2H2 | ü | |
| M5-6 | 17.40 | C13H16O4 | 235.0980 | 1.8 | −H | 203.05, 163.02, 147.05, 134.05 | Tri-methylation of A5 | A5 + C3H6 | ü | |
| A6 | 7.27 | C12H12O4 | 219.0675 | 5.6 | −H | 175.08, 160.03, 119.02 | Acetylated methyl coumarate | − | ü | |
| M6-1 | 8.76 | C12H14O4 | 221.0828 | 3.9 | −H | 175.09, 160.05, 116.03 | Hydrogenation of A6 | A6 + H2 | ü | |
| M6-2 | 12.88 | C12H14O3 | 205.0865 | -2.5 | −H | 175.04, 132.06, 126.00, 119.05 | Deoxidation + Hydrogenation of A6 | A6 − O + H2 | ü | |
| M6-3 | 15.89 | C14H16O4 | 247.0970 | -2.4 | −H | 203.11, 160.03, 119.05 | Di-methylation of A6 | A6 + 2CH2 | ü | |
| A7 | 8.62 | C7H6O3 | 137.0248 | 2.8 | −H | 109.02, 93.03, 65.04 | Protocatechualdehyde | − | ü | |
| M7-1 | 2.46 | C13H14O9 | 313.0581 | 5.1 | −H | 137.02, 113.02, | Glucuronidation of A7 | A7 + C6H8O6 | ü | |
| M7-2 | 3.47 | C14H16O9 | 327.0727 | 1.7 | −H | 151.04, 137.02, 113.03 | Methylation + Glucuronidation of A7 | A7 +C6H8O6 + CH2 | ü | |
| A8 | 8.76 | C12H14O4 | 221.0828 | 3.9 | −H | 177.01, 161.07, 130.05 | Ethyl ferulate | − | ü | ü |
| M8-1 | 9.92 | C12H16O4 | 223.0982 | 2.8 | −H | 179.03, 161.10, 142.01, 135.01 | Hydrogenation of A8 | A8 + H2 | ü | |
| M8-2 | 12.44 | C12H16O3 | 207.1039 | 5.9 | −H | 192.08, 175.08, 163.04, 135.03 | Deoxidation + Hydrogenation of A8 | A8 − O + H2 | ü | |
| M8-3 | 13.08 | C12H12O3 | 203.0726 | 6.1 | −H | 159.08, 130.04, 115.01 | Dehydration of A8 | A8 −H2O | ü | |
| M8-4 | 15.61 | C12H14O3 | 205.0865 | -2.5 | −H | 161.09, 126.01 | Deoxidation of A8 | A8 − O | ü | ü |
| A9 | 8.90 | C12H16O4 | 225.1111 | -4.6 | +H | 207.15, 189.12, 161.11, 128.10 | Senkyunolide I * | − | ü | ü |
| M9-1 | 8.32 | C12H18O4 | 227.1272 | -2.6 | +H | 191.10, 163.10, 153.06, 121.10 | Hydrogenation of A9 | A9 + H2 | ü | ü |
| M9-2 | 10.61 | C12H14O3 | 207.1010 | -2.8 | +H | 175.13, 153.13, 128.05 | Dehydration of A9 | A9 − H2O | ü | ü |
| M9-3 | 11.84 | C12H14O2 | 191.1059 | -4 | +H | 173.10, 145.05, 135.04, 115.07 | Deoxidation + Dehydration of A9 | A9 − H2O − O | ü | |
| M9-4 | 14.49 | C12H16O3 | 209.1170 | -1.1 | +H | 193.00, 145.10, 35.04, 91.05 | Deoxidation of A9 | A9 − O | ü | |
| M9-5 | 16.16 | C12H16O2 | 193.1228 | 2.6 | +H | 161.10, 128.03, 91.06 | Di-deoxidation of A9 | A9 − 2O | ü | |
| A10 | 9.39 | C18H16O8 | 359.0783 | 2.9 | −H | 197.06, 179.04, 161.03, 135.04 | Rosmarinic acid * | ü | ||
| M10-1 | 7.27 | C18H18O7 | 345.1004 | 7.0 | −H | 301.11, 257.12, 241.09, 229.10 | Deoxidation + Hydrogenation of A10 | A10 − O + H2 | ü | |
| M10-2 | 17.24 | C18H16O5 | 311.0945 | 6.4 | −H | 267.10, 193.10, 161.03 | Tri-deoxidation of A10 | A10 − 3O | ü | |
| A11 | 9.78 | C27H22O12 | 537.1055 | 3.1 | −H | 493.12, 379.10, 295.05, 185.03 | Lithospermic acid* | − | ü | |
| M11-1 | 11.51 | C28H24O12 | 551.1199 | 0.7 | −H | 309.08, 295.05, 197.04, 179.03 | Methylation of A11 | A11 + CH2 | ü | |
| M11-3 | 13.60 | C29H26O12 | 565.1381 | 5.2 | −H | 327.09, 295.05, 211.06, 172.02 | Di-methylation of A11 | A11 + 2CH2 | ü | |
| A12 | 10.70 | C36H30O16 | 717.1509 | 6.7 | −H | 537.11, 493.10, 339.05, 295.05 | Salvianolic acid B* | − | ü | |
| M12-1 | 9.57 | C36H30O13 | 669.1501 | -6.5 | −H | 493.12, 339.05, 295.06, 185.02 | Deoxidation of A12 | A12 − 3O | ü | |
| M12-2 | 12.22 | C37H32O16 | 731.1662 | 6.1 | −H | 537.11, 339.06, 295.07, 185.03 | Methylation of A12 | A12 + CH2 | ü | |
| A13 | 11.79 | C26H22O10 | 493.1132 | -1.7 | −H | 295.06, 185.02, 159.05, 109.03 | Salvianolic acid A* | − | ü | |
| A14 | 15.75 | C12H12O2 | 189.0906 | -2.1 | +H | 171.08, 153.07, 147.04, 133.03 | Butylidenephthalide * | − | ü | ü |
| M14-1 | 9.00 | C12H10O | 171.0801 | -2 | +H | 152.06, 143.09, 128.06, 115.03 | Dehydration of A14 | A14 − H2O | ü | |
| M14-2 | 9.81 | C18H20O9 | 381.1174 | -1.6 | +H | 205.08, 189.06, 159.04, 141.07 | Hydroxylation + Glucuronidation of A14 | A14 + C6H8O6 + O | ü | |
| M14-3 | 10.45 | C12H12O4 | 221.0804 | -2 | +H | 189.09, 175.14, 118.08, 88.08 | Di-hydroxylation of A14 | A14 + 2O | ü | |
| M14-4 | 13.43 | C12H12O3 | 205.0852 | -3.5 | +H | 187.07, 169.06, 141.07, 129.07 | Oxidation of A14 | A14 + O | ü | ü |
| M14-5 | 13.74 | C18H20O10 | 397.1109 | -5.1 | +H | 221.08, 203.06, 185.06, 147.09 | Dihydroxylation + Glucuronidation of A14 | A14 + C6H8O6 + 2O | ü | |
| M14-6 | 15.66 | C12H14O3 | 207.101 | -2.8 | +H | 189.09, 147.04, 133.03, 128.06 | Hydroxylation + Hydrogenation of A14 | A14 + O + H2 | ü | |
| M14-7 | 15.93 | C12H14O2 | 191.1059 | -4 | +H | 173.08, 145.07, 133.03, 115.06 | Hydrogenation of A14 | A14 + H2 | ü | |
| A15 | 17.11 | C20H18O5 | 339.1221 | -1.8 | +H | 279.12, 261.16, 233.13, 205.11 | Methyl tanshinonate | − | ü | |
| M15-1 | 18.89 | C20H20O5 | 341.1388 | 1.3 | +H | 281.11, 263.10, 235.11, 220.05 | Hydrogenation of A14 | A15 + H2 | ü | |
| A16 | 18.02 | C18H16O3 | 281.1174 | 0.6 | +H | 263.11, 249.00, 235.11, 220.08 | Trijuganone B | − | ü | |
| M16-1 | 16.24 | C17H16O3 | 269.1162 | -3.8 | +H | 269.12, 251.10, 233.09, 205.09 | Demethylation + Hydrogenation of A15 | A16 − CH2 +H2 | ü | |
| M16-2 | 17.41 | C17H18O2 | 255.1374 | -2.2 | +H | 237.12, 225.09, 209.09, 194.11 | Decarbonylation + Hydrogenation of A15 | A16 − CO + H2 | ü | |
| A17 | 18.13 | C19H18O4 | 311.1273 | -1.6 | +H | 267.13, 252.11, 237.09, 223.07 | Tanshinone IIb | − | ü | |
| M17-1 | 15.71 | C19H18O5 | 327.1226 | -0.3 | +H | 281.11, 263.10, 235.11, 220.08 | Hydroxylation of A17 | A17 + O | ü | |
| M17-2 | 18.76 | C18H14O3 | 279.1006 | -3.5 | +H | 261.09, 233.09, 205.10, 149.02 | Demethylation + Dehydration of A17 | A17 − CH2 − H2O | ü | |
| A18 | 18.38 | C12H16O2 | 193.1228 | 2.6 | +H | 175.11, 147.11, 135.07, 105.08 | Senkyunolide A * | − | ü | ü |
| M18-1 | 8.90 | C18H24O10 | 401.1436 | -1.6 | +H | 207.09, 193.09, 147.09, 135.04 | Dihydroxylation + Glucuronidation of A18 | A18 + C6H8O6 + 2O | ü | |
| M18-2 | 9.90 | C12H16O4 | 225.1111 | -4.6 | +H | 207.09, 193.13, 147.06, 135.04 | Di-hydroxylation of A18 | A18 + 2O | ü | |
| M18-3 | 10.49 | C12H16O3 | 209.117 | -1.1 | +H | 193.01, 147.03, 135.05, 119.10 | Hydroxylation of A18 | A18 + O | ü | |
| M18-4 | 12.26 | C12H18O3 | 211.1325 | -1.8 | +H | 193.12, 151.07, 121.06, 79.05 | Hydration of A18 | A18 + H2O | ü | |
| M18-5 | 15.54 | C12H14O2 | 191.1059 | -4 | +H | 173.10, 145.10, 135.02, 115.06 | Dehydrogenation of A18 | A18 − H2 | ü | ü |
| M18-6 | 18.96 | C12H18O2 | 195.1368 | -5.9 | +H | 193.12, 175.09, 137.06, 103.07 | Hydrogenation of A18 | A18 + H2 | ü | |
| A19 | 18.68 | C12H14O2 | 191.1059 | -4 | +H | 173.13, 145.12, 135.09, 115.10 | Butylphthalide * | − | ü | ü |
| M19-1 | 7.39 | C18H22O10 | 399.1279 | -1.7 | +H | 187.07, 159.08, 149.02, 133.05 | Dihydroxylation + Glucuronidation of A19 | A19 + C6H8O6 + 2O | ü | |
| M19-2 | 8.32 | C12H16O3 | 209.1169 | -1.5 | +H | 175.13, 149.03, 118.12 | Hydroxylation + Hydrogenation of A19 | A19 + O + H2 | ü | |
| M19-3 | 8.79 | C18H22O9 | 383.1337 | 0.1 | +H | 207.10, 189.08, 161.09, 133.05 | Hydroxylation + Glucuronidation of A19 | A19 + C6H8O6 + O | ü | |
| M19-4 | 8.91 | C12H14O3 | 207.1010 | -2.8 | +H | 191.10, 175.12, 135.08, 115.03 | Hydroxylation of A19 | A19 + O | ü | ü |
| M19-5 | 16.02 | C12H12O2 | 189.0910 | 0 | +H | 153.07, 143.08, 128.06, 115.06 | Desaturation of A19 | A19 − H2 | ü | |
| A20 | 18.78 | C19H18O5 | 327.1226 | -0.3 | +H | 309.11, 265.12, 236.08, 223.07 | Dihydroxytanshinone IIA | − | ü | ü |
| M20-1 | 16.82 | C18H14O4 | 295.0965 | 0.1 | +H | 251.10, 249.10, 223.11, 208.08 | Demethylation + Dehydration of A20 | A20 − CH2 − H2O | ü | |
| M20-2 | 18.03 | C19H20O5 | 329.1378 | -1.7 | +H | 311.12, 283.05, 267.10, 225.07 | Hydrogenation of A20 | A20 + H2 | ü | ü |
| M20-3 | 19.07 | C18H18O4 | 299.1275 | -1.0 | +H | 283.05, 263.10, 251.00, 235.11 | Decarbonylation of A20 | A20 − CO | ü | |
| A21 | 19.78 | C12H18O2 | 195.1368 | -5.9 | +H | 163.04, 135.08, 97.08, 79.07 | Neocnidilide | − | ü | ü |
| M21-1 | 7.63 | C12H18O4 | 227.1272 | -2.6 | +H | 195.10, 184.09, 163.08, 135.09 | Di-hydroxylation of A21 | A21 + 2O | ü | |
| M21-2 | 7.92 | C18H26O10 | 403.1593 | -1.4 | +H | 209.11, 191.10, 153.05, 145.10 | Dihydroxylation + Glucuronidation of A21 | A21 + C6H8O8 +2O | ü | |
| M21-3 | 10.23 | C18H26O9 | 387.1643 | -1.7 | +H | 211.13, 193.12, 121.06 | Oxidation + Glucuronidation of A21 | A21 + C6H8O6 + O | ü | ü |
| A22 | 19.84 | C18H14O3 | 279.1006 | -3.5 | +H | 261.09, 233.09, 205.09, 190.08 | Dihydrotanshinone I * | − | ü | ü |
| A22-1 | 12.77 | C24H22O9 | 455.134 | 0.7 | +H | 279.09, 233.09, 206.06, 190.07 | Glucuronidation of A22 | A22 + C6H8O6 | ü | ü |
| A22-2 | 15.54 | C18H14O4 | 295.0965 | 0 | +H | 251.10, 249.09, 221.09, 205.10 | Hydroxylation of A22 | A22 + O | ü | |
| A22-3 | 16.37 | C18H12O4 | 293.0803 | -1.8 | +H | 249.09, 234.06, 178.07, 152.06 | Ketone Formation of A22 | A22 − H2 + O | ü | |
| A22-4 | 17.76 | C18H16O5 | 313.1061 | -3 | +H | 295.08, 277.03, 251.10, 221.06 | Hydroxylation + Internal Hydrolysis of A22 | A22 + O + H2O | ü | |
| A22-5 | 17.96 | C18H14O5 | 311.0914 | 0 | +H | 265.08, 247.07, 219.08, 191.09 | Di-hydroxylation of A22 | A22 + 2O | ü | |
| A22-6 | 18.77 | C18H16O4 | 297.1092 | -9.9 | +H | 281.05, 265.01, 233.09, 205.10 | Internal Hydrolysis of A22 | A22 + H2O | ü | |
| A22-7 | 20.35 | C18H16O3 | 281.1174 | 0.6 | +H | 263.10, 249.10, 235.10, 192.09 | Hydrogenation of A22 | A22 + H2 | ü | |
| A23 | 19.87 | C19H22O4 | 315.1594 | 1.1 | +H | 297.13, 279.10, 264.10, 251.09 | Neocryptotanshinone | − | ü | |
| M23-1 | 17.32 | C19H22O5 | 331.1533 | -2.1 | +H | 313.15, 269.15, 254.11, 241.12 | Hydroxylation of A22 | A23 + O | ü | |
| M23-2 | 22.74 | C18H22O3 | 287.1639 | -0.9 | +H | 269.15, 239.10, 221.08, 171.08 | Decarbonylation of A22 | A23 − CO | ü | |
| A24 | 19.95 | C12H14O2 | 191.1059 | -4 | +H | 175.08, 145.10, 135.04, 115.07 | Ligustilide* | − | ü | ü |
| M24-1 | 9.99 | C18H22O9 | 383.1337 | 0.1 | +H | 189.09, 161.09, 151.04, 107.05 | Hydroxylation + Glucuronidation of A24 | A24 + C6H8O6 + O | ü | |
| M24-2 | 15.93 | C12H16O3 | 209.1169 | -1.5 | +H | 191.11, 173.13, 149.03, 115.06 | Hydroxylation + Hydrogenation of A24 | A24 + O + H2 | ü | |
| M24-3 | 17.00 | C12H14O3 | 207.1010 | -2.8 | +H | 191.10, 173.09, 135.03, 115.08 | Hydroxylation of A24 | A24 + O | ü | ü |
| M24-4 | 19.11 | C12H12O2 | 189.0906 | -2.1 | +H | 171.07, 147.04, 133.3, 113.02 | Desaturation of A24 | A24 − H2 | ü | ü |
| M24-5 | 19.53 | C13H16O3 | 221.1175 | 1.3 | +H | 189.10, 17107, 133.03, 128.06 | Hydroxylation + Methylation of A24 | A24 + CH2 + O | ü | |
| M24-6 | 20.25 | C12H14O | 175.1128 | 6 | +H | 141.06, 131.09, 105.07, 93.01 | Deoxidation of A24 | A24 − O | ü | |
| M24-7 | 20.58 | C12H12O | 173.0957 | -2.3 | +H | 145.10, 132.02, 115.06, 91.03 | Dehydration of A24 | A24 − H2O | ü | |
| A25 | 20.56 | C19H20O4 | 313.1433 | -0.4 | +H | 295.13, 267.13, 253.12, 235.12 | Miltionone I | − | ü | ü |
| M25-1 | 14.73 | C19H20O6 | 345.1330 | -0.8 | +H | 309.10, 281.11, 267.12, 235.11 | Di-hydroxylation of A25 | A26 + O2 | ü | |
| M25-2 | 16.66 | C19H20O5 | 329.1385 | 0.5 | +H | 283.13, 265.12, 235.07, 207.02 | Hydroxylation of A25 | A26 + O | ü | |
| M25-3 | 19.39 | C18H20O3 | 285.1484 | -0.4 | +H | 267.13, 238.10, 219.08, 187.03 | Decarbonylation of A25 | A26 − CO | ü | |
| A26 | 21.62 | C18H12O3 | 277.0856 | -1.2 | +H | 262.06, 249.08, 234.07, 221.09 | Tanshinone I | − | ü | |
| M26-1 | 13.83 | C24H20O9 | 453.1170 | -2.2 | +H | 277.09, 249.08, 227.05, 205.09 | Glucuronidation of A25 | A26 + C6H8O6 | ü | |
| M26-2 | 17.51 | C18H14O4 | 295.0965 | 0 | +H | 277.08, 249.09, 221.09, 206.07 | Internal Hydrolysis of A25 | A26 + H2O | ü | |
| M26-3 | 17.65 | C18H12O4 | 293.0803 | -1.8 | +H | 247.07, 237.09, 219.08, 166.03 | Hydroxylation of A25 | A26 + O | ü | |
| M26-4 | 17.96 | C17H12O3 | 265.0853 | -2.3 | +H | 222.06,237.09,265.08 | Demethylation + Hydrogenation of A25 | A26 − CH2 + H2 | ü | |
| M26-5 | 18.12 | C24H22O9 | 455.134 | 0.7 | +H | 279.09, 261.08. 233.09, 205.10 | Hydrogenation + Glucuronidation of A25 | A26 + C6H8O6 + H2 | ü | |
| M26-6 | 22.36 | C18H14O3 | 279.1006 | -3.5 | +H | 249.10, 233.10, 205.09, 149.02 | Hydrogenation of A25 | A26 + H2 | ü | |
| A27 | 21.67 | C19H20O3 | 297.1483 | -0.7 | +H | 283.04, 265.01, 249.05, 237.09 | Cryptotanshinone* | − | ü | ü |
| M27-1 | 10.52 | C19H18O5 | 327.1233 | 1.8 | +H | 297.08, 28105, 223.06, 205.09 | Demethylation + Decarboxylation of A27 | A27 − CH2 + CO2 | ü | |
| M27-2 | 17.85 | C19H16O5 | 325.1067 | -1.1 | +H | 297.11, 279.09, 261.09, 233.09 | Di-hydration of A27 | A27 + 2H2O | ü | |
| M27-3 | 18.08 | C18H22O3 | 287.1639 | -0.9 | +H | 269.15, 251.14, 239.10, 209.10 | Decarbonylation + Hydroxylation + Hydrogenation of A27 | A27 − C + H2 | ü | |
| M27-4 | 19.42 | C25H28O9 | 473.1803 | -0.7 | +H | 309.14, 297.15, 279.13, 251.14 | Glucuronidation of A27 | A27 + C6H8O6 | ü | |
| M27-5 | 19.63 | C19H20O5 | 329.1378 | -1.7 | +H | 311.12, 283.13, 265.12, 237.12 | Di-hydroxylation of A27 | A27 + 2O | ü | |
| M27-6 | 19.98 | C19H18O4 | 311.128 | 0.7 | +H | 297.08, 281.05, 223.06, 207.03 | Ketone Formation of A27 | A27 − H2 + O | ü | |
| M27-7 | 20.49 | C19H22O4 | 315.1594 | 1 | +H | 297.14, 281.12, 267.10, 237.09 | Internal Hydrolysis of A27 | A27 + H2O | ü | ü |
| M27-8 | 20.72 | C19H20O4 | 313.1433 | -0.4 | +H | 295.13, 271.13, 253.12, 235.11 | Hydroxylation of A27 | A27 + O | ü | |
| A28 | 22.38 | C24H30O4 | 383.2209 | -2.1 | +H | 193.12, 175.14, 161.06, 137.09 | Senkyunolide P | − | ü | |
| M28-1 | 20.35 | C24H30O5 | 399.2156 | -2.4 | +H | 251.10, 191.10, 175.06 | Hydroxylation of A28 | A28 + O | ü | |
| A29 | 23.07 | C12H12O3 | 205.0852 | -3.5 | +H | 169.09, 149.03, 121.03, 115.03 | Senkyunolide C | − | ü | |
| M29-1 | 11.71 | C18H20O9 | 381.1174 | -1.6 | +H | 205.08, 169.09, 149.03 | Glucuronidation of A29 | A29 + C6H8O6 | ü | |
| M29-2 | 12.52 | C13H14O4 | 235.0956 | -3.8 | +H | 193.04, 179.03, 149.02, 131.05 | Hydroxylation + Methylation of A29 | A29 + CH2 + O | ü | |
| M29-3 | 17.71 | C12H10O3 | 203.0696 | -3.3 | +H | 185.05, 157.06, 128.06, 115.05 | Desaturation of A29 | A29 − H2 | ü | |
| A30 | 23.31 | C25H32O5 | 413.2321 | -0.4 | +H | 223.13, 191.10, 149.06 | Wallichilide | − | ü | ü |
| M30-1 | 20.37 | C25H32O8 | 461.2165 | -1.1 | +H | 285.18, 267.17, 225.12, 197.09 | Tri-hydroxylation of A30 | A30 + 3O | ü | ü |
| A31 | 23.51 | C19H18O3 | 295.1325 | -1.3 | +H | 277.12, 249.12, 234.10, 206.11 | Tanshinone IIA * | − | ü | ü |
| M31-1 | 17.04 | C19H18O5 | 327.1226 | -0.3 | +H | 309.10, 295.06, 277.11, 255.10 | Di-hydroxylation of A31 | A31 + 2O | ü | |
| M31-2 | 18.58 | C18H18O2 | 267.1377 | -1 | +H | 249.12, 231.12, 221.09, 207.08 | Decarbonylation of A31 | A31 − CO | ü | |
| M31-3 | 18.78 | C19H16O4 | 309.1114 | -2.4 | +H | 281.10, 265.12, 247.11, 223.07 | Ketone Formation of A31 | A31 − H2 + O | ü | ü |
| M31-4 | 19.42 | C25H28O9 | 473.1803 | -0.7 | +H | 309.14, 297.15, 279.13, 251.14 | Hydrogenation + Glucuronidation of A31 | A31 + C6H8O6 + H2 | ü | |
| M31-5 | 19.62 | C19H18O4 | 311.1273 | -1.6 | +H | 295.13, 277.10, 249.09, 237.10 | Hydroxylation of A31 | A31 + O | ü | |
| M31-6 | 21.45 | C19H20O4 | 313.1433 | -0.4 | +H | 295.13, 277.12, 267.13, 249.13 | Internal Hydrolysis of A31 | A31 + H2O | ü | ü |
| M31-7 | 22.56 | C18H18O4 | 299.1275 | -1 | +H | 283.05, 267.02, 251.00, 235.10 | Decarbonylation + Di-hydroxylation of A31 | A31 − C + O | ü | |
| A32 | 23.54 | C24H28O4 | 381.2057 | -0.9 | +H | 191.10, 173.09, 149.06, 135.04 | Levistilide A* | − | ü | ü |
| M32-1 | 18.55 | C24H30O6 | 415.2123 | 1.9 | +H | 381.03, 191.10, 135.08, 119.08 | Hydroxylation + Hydration of A32 | A32 + O + H2O | ü | |
| M32-2 | 20.35 | C24H30O5 | 399.2156 | -2.5 | +H | 191.10, 149.05, 135.03, 85.06 | Hydroxylation + Hydrogenation of A32 | A32 + O + H2 | ü | |
| M32-3 | 23.76 | C24H30O4 | 383.2209 | -2.1 | +H | 191.10, 161.09, 145.10 | Hydrogenation of A32 | A32 + H2 | ü | |
| A33 | 24.08 | C19H22O2 | 283.1697 | 1.6 | +H | 265.21, 240.16, 223.15, 205.14 | Miltirone | ü | ü | |
| M33-1 | 14.66 | C25H32O8 | 461.2182 | 2.6 | +H | 285.19, 267.17, 239.09, 225.12 | Hydrogenation + Glucuronidation of A33 | A33 + C6H8O6 + H2 | ü | |
| M33-2 | 19.37 | C19H20O3 | 297.1483 | -0.7 | +H | 281.05, 265.02, 249.00, 207.03 | Ketone Formation of A33 | A33 − H2 + O | ü | |
| M33-3 | 20.06 | C19H24O2 | 285.1842 | -2.5 | +H | 267.17, 225.13, 215.10, 181.06 | Hydrogenation of A33 | A33 + H2 | ü |
3.4. Identification of prototypes of SM-LC in rat brain and plasma
According to the identified compounds of SM-LC and the MS/MS data of the biological samples, a total of 33 prototypes (33 in plasma and 16 in brain) were detected. Among the 33 prototypes, 16 were confirmed by the chemical references. The plasma prototypes included 12 phenolic acids, 11 tanshinones, and 10 phthalides; while the brain prototypes included 8 phthalides, 2 phenolic acids, and 6 tanshinones. Chemical structures of the 33 prototypes has been displayed in Figure S5.
3.4.1. Characterization of phenolic acids related metabolites
Our previous work identified 46 phenolic acids from SM-LC in the negative electrospray Ionization (ESI) mode, the phenolic acids could be categorized into polymers (salvianolic acid B and lithospermic acid, etc.) and monomers (danshensu and caffeic acid, etc.) [23]. According to the potential metabolic reactions of the 46 identified phenolic acids [14], these phenolic acids could yield 1001 phenolic acids-related metabolites. The theoretical molecular weight of these metabolites was divided into both decimal and integral parts, which were applied for the establishment of the MMDF screening window of phenolic acids (Y range 3.3 − 276.3 mDa; X range 65 − 950 Da). Diagnostic fragment ions filtering (DFIF) and neutral loss filtering (NLF) can help further characterize candidate ions that fall within the MMDF screening window. For DFIF, the product ions at m/z 179 and 197 could be used as the typical diagnostic fragment ions for phenolic acids [4]. For NLF, due to the carboxyl and hydroxyl groups, the neutral loss of CO (28 Da), H2O (18 Da), and CO2 (44 Da) could be found in their MS/MS spectra [24]. As a result, 12 prototypes and 34 related metabolites in plasma, as well as 2 prototypes and 3 related metabolites in the brain were identified.
Prototypes A13, A12, A11, A10, A5, A4, and A1 were characterized as salvianolic acid A, salvianolic acid B, lithospermic acid, rosmarinic acid, ferulic acid, caffeic acid, and danshensu, respectively, by referring to the chemical references. Taken salvianolic acid B (A12, m/z 717.1509) and danshensu (A1, m/z 197.0466) related metabolites as examples, the former was usually metabolized into the latter in vivo. M12-1 and M12-2 showed identical product ions (m/z 493.10, 339.05 and 295.07) as that of A12. Hence, they were salvianolic acid B-related metabolites. M12-1 exhibited [M−H]− ion at m/z 669.1501, and its molecular weight was determined as C36H30O13, which could be generated by losing three molecules of O (48 Da) from A12. M12-1 was then deduced as the deoxidation metabolite of A12. Similarly, M12-2 was tentatively identified as the methylation product of A12. M1-1 (m/z, 373.0788), M1-4 (m/z, 357.0844), and M1-6 (m/z, 267.0886) generated product ions at m/z 197.0, 179.0, and 161.0, respectively, which were representative fragment ions of danshensu, suggesting they were metabolites related to danshensu [19]. Through comparison with the precursor ion of danshensu (m/z 257.0660), the additional molecules C6H8O6 (176 Da), C6H8O5 (160 Da), C2H4 (28 Da) and OC2H2 (42 Da) units could be detected for M1-1, M1-4, and M1-6. Therefore, M1-1, M1-4, and M1-6 were deduced as the glucuronidation, glucuronidation and deoxidation, and methylation and acetylation products of A1, respectively. M1-2, M1-3, and M1-5 showed the [M−H]− ions at m/z 181.0515 (C9H10O4), 165.0561 (C9H10O3), and 195.0676 (C10H12O4), respectively. Their fragmentation ions (135.1, 123.1, and 103.0, respectively) were similar to those of danshensu [22]. Therefore, M1-2, M1-3, and M1-5 were deduced as the deoxidation, di-deoxidation, as well as methylation and deoxidation metabolites of danshensu, respectively. The possible metabolic pathways of phenolic acids in rat plasma and brain have been shown in Figure 4. Glucuronidation, deoxidation, methylation, dehydrogenation, and acetylation were the major metabolic reactions of phenolic acids in MCAO/R rats (Figure 3a).
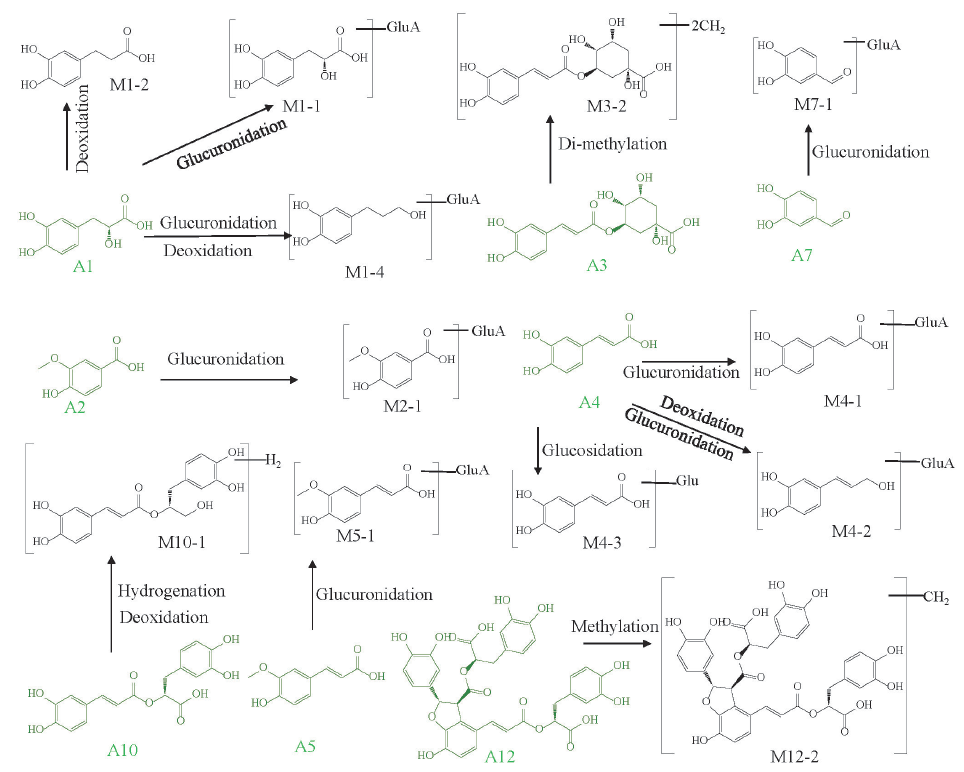
- The metabolic pathways of phenolic acids in MCAO/R rat biological samples.
3.4.2. Characterization of phthalides related metabolites
Phthalides were widely found in LC with high concentrations and multiple effects [25]. Fifteen phthalides were identified in the positive ESI mode, and were selected to construct the MMDF window of phthalides, generating 319 possible phthalides-related metabolites [26,27]. The molecular weights of these 319 metabolites were separated into decimal (y) and integer (x) parts, which were plotted on an XY scatter plot, forming the MMDF window (Y range 44.9 – 287.3 mDa; X range 154 – 622 Da). To reduce the false positive results, the consecutive neutral losses (15, 18, 28 and 44 Da) and RT ranges (8.9−25 mins) were applied for the identification of phthalides [27]. The MMDF windows of phthalides were utilized to process the positive MS data. A total of 871 and 267 potential ions from plasma and brain were screened. Then chemical references, combined with DFIF, NLF, and other data processing techniques, assisted in the characterization of 11 phthalides prototypes (11 in plasma and 8 in brain) and 40 metabolites (33 in plasma and 17 in brain).
Compounds A9, A14, A18, A19, A24 were accurately clarified as senkyunolide I, butylidenephthalide, senkyunolide A, butylphthalide, and ligustilide by comparing with chemical standards. Moreover, other five prototypes were presumed to be neocnidilide, senkyunolide P, senkyunolide C, wallichilide, and angelicolide with assistance of the literature [1]. Metabolite M9-3, M13-7, and M17-5 with the retention times at 9.51, 15.95, and 17.46 mins, exerted the same quasi-molecular ions at m/z 191.1059. Their molecular formulae were all deduced as C12H14O2. The m/z 191.1059 ([M+H]+) yielded the fragment ions at m/z 173.10 ([M+H−H2O]+), 145.10 ([M+H−CO−H2O]+), 133.10 ([M+H−OCH2−CO]+), and 115.10 ([M+H−OCH2−CO−H2O]+). Consulting to the literature [25], M9-3, M13-7, and M17-5 were reasonably identified as the deoxidation and dehydration metabolite of senkyunolide I (8.90 min, m/z 225.1111), hydrogenation of butylidenephthalide (15.75 min, m/z 189.0906) and dehydrogenation of senkyunolide A (18.38 min, m/z 193.1228). M17-1 (m/z 401.1436), M17-2 (m/z 225.1111), and M17-3 (m/z 209.1170) generated the product ions at m/z 193.10, 147.10, and 135.10, respectively, which were the representative product ions of senkyunolide A, indicating they were senkyunolide A related metabolites. Compared with senkyunolide A (m/z 193.1228), the additional C6H8O6 (176 Da) + 2O (32 Da), 2O (32 Da), and O (16 Da) groups could be determined for M17-1, M17-2 and M17-3, accordingly. Hence, M17-1, M17-2 and M17-3 were tentatively identified as the dihydroxylation and glucuronidation, dihydroxylation, hydroxylation products of senkyunolide A [28]. Similarly, other phthalides-related metabolites were identified by comparing their MS data with the relevant literature. The main metabolic process of phthalides in rat brain and plasma included hydrogenation, dehydration, glucuronidation, and deoxidation (Figure 3b and Figure 5).
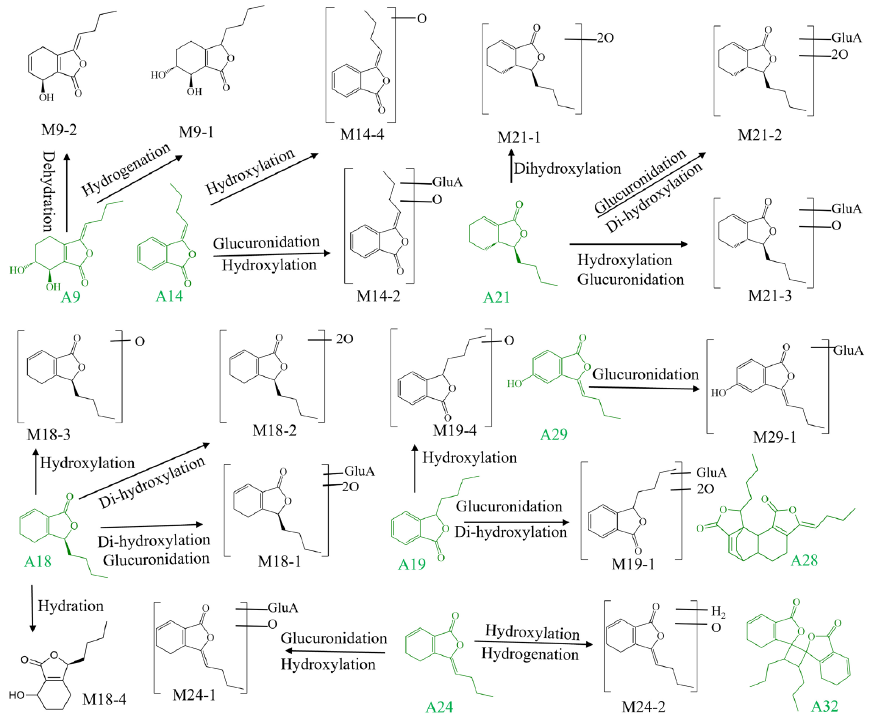
- The metabolic pathways of phthalides in MCAO/R rat biological samples.
3.4.3. Characterization of tanshinones related metabolites
A total of 14 tanshinones in SM-LC were characterized in the positive ESI mode. Two MMDF regions of tanshinones (phase II and phase I metabolisms) were used for the data processing of MS spectra, and 395 and 97 candidate ions in plasma and brain were discovered, respectively. Moreover, the typical product ions (m/z 269, 267, 249, 235, and 219 Da) and the typical neutral losses (44 Da, 28 Da, and 15 Da) were also used to discover the tanshinones-related metabolites [29].
By comparison with chemical standards, A31, A27, and A22 were definitely identified as tanshinone IIA, cryptotanshinone, and dihydrotanshinone I, respectively. Other seven tanshinones were presumed through literature review. The 11 tanshinones would contribute to the characterization of 44 metabolites. Among these metabolites, 7 originated from tanshinone IIA. M30-1, M30-5, and M30-6 produced the product ions at m/z 295.10, 277.10, and 249.10, respectively, which were identical to the typical diagnostic ions of tanshinone IIA. These metabolites exerted the [M+H]+ ions at m/z 327.1226 (M30-1), 311.1273 (M30-5), and 313.1433 (M30-6), which are 32 Da (+2O), 16 Da (+O), and 18 Da (+H2O) higher than tanshinone IIA, respectively. M30-1, M30-5, and M30-6 were inferred to be the dihydroxylation, hydroxylation, and internal hydrolysis metabolites of tanshinone IIA, respectively [29]. Similarly, other 4 tanshinone IIA-related metabolites were also identified. In general, a total of 55 tanshinones-related metabolites were identified in the biological samples, including 51 in plasma (11 prototypes and 40 metabolites), 15 in brain (6 prototypes and 9 metabolites). Glucuronidation, hydrolysis, hydroxylation hydrogenation, and decarbonylation were the major metabolic patterns of tanshinones (Figure 3c and Figure 6).
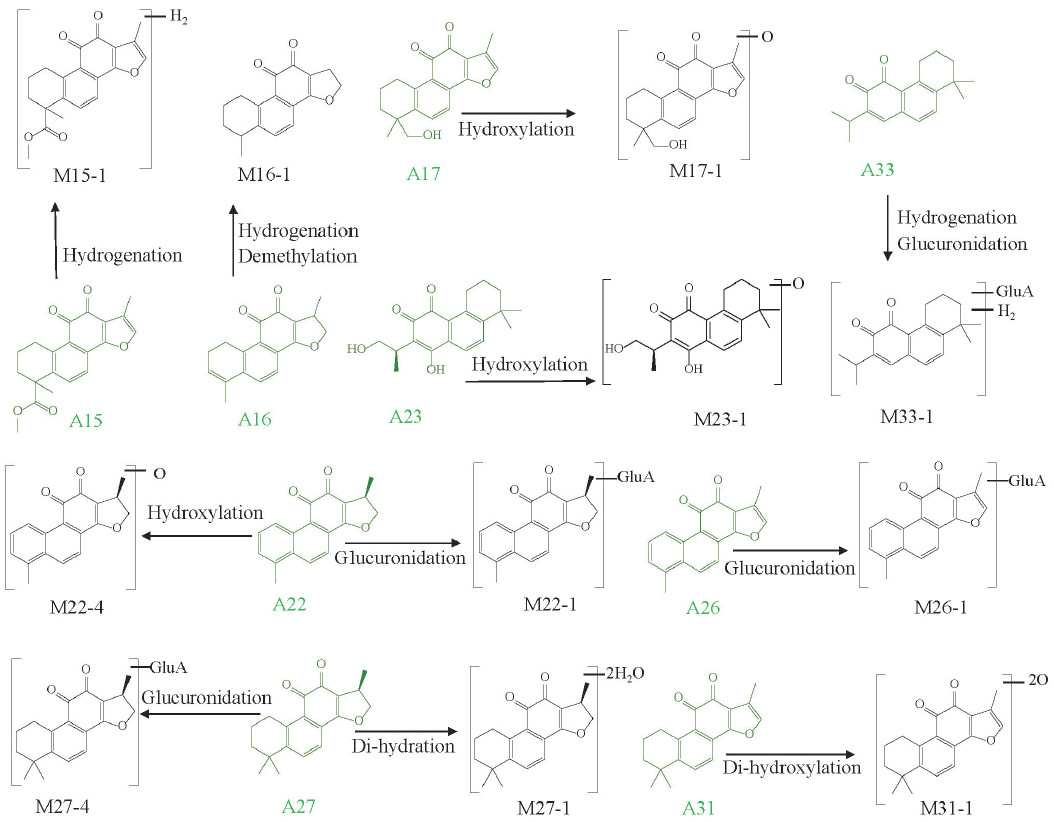
- The metabolic pathways of tanshinones in MCAO/R rat biological samples.
3.5. Method validation of pharmacokinetics
3.5.1. Specificity and selectivity
Typical MRM chromatograms for the blank control plasma, the blank control plasma added with IS and target analytes, and drug-containing plasma have been shown in Figure 7. No obvious endogenous interference (lower than 20% of the LLOQ) was observed during the pharmacokinetics analysis.
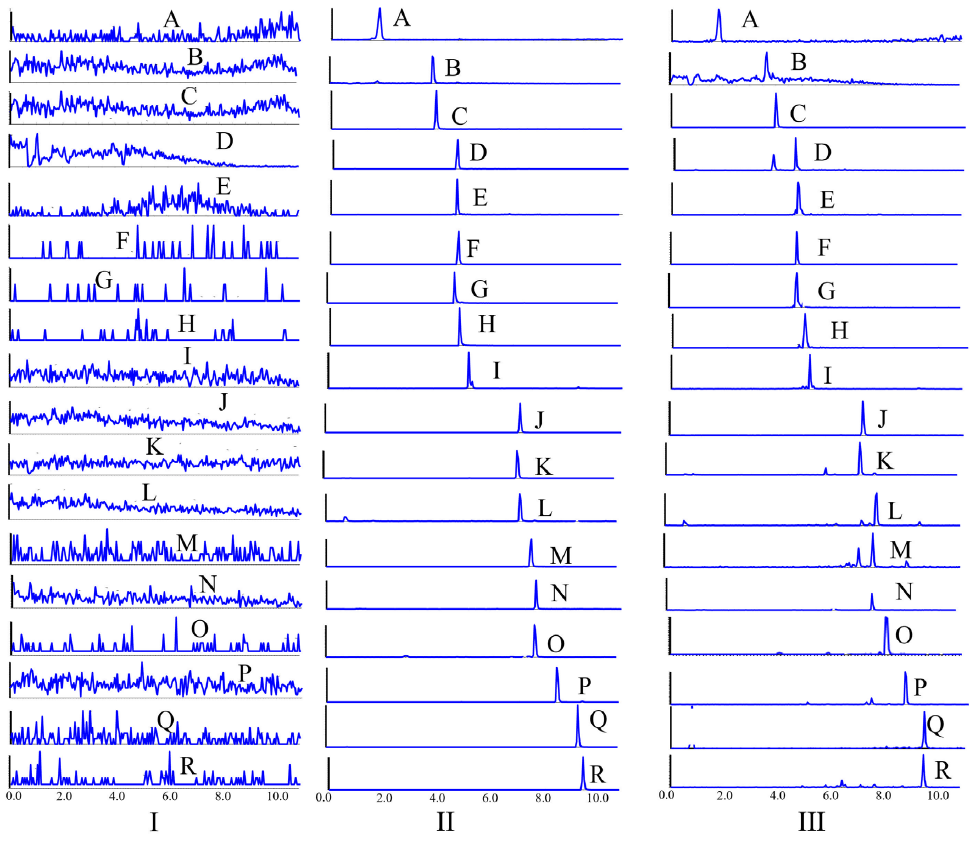
- Typical MRM chromatograms of (I) blank plasma, (II) blank plasma spiked with 16 analytes and (III) drug-containing plasma. A Danshensu; B Caffeic acid; C Phenformin; D Ferulic acid; E Lithospermic acid; F Rosmarinic acid; G Salvianolic acid A; H Salvianolic acid B; I Senkyunolide I; J Senkyunolide A; K: 3-n-butylphathlide; L Dihydrotanshinone I; M Ligustilide; N Ketoprofen; O Butylidenephthalide; P Crytotanshinone; Q Levistilide A; R Tanshinone IIA. MRM: Multiple reaction monitoring.
3.5.2. Linearity and LLOQ
A weighted least squares regression model using the weight value 1/x2 was applied for the development of the calibration curves. The concentrations of calibration standards measured by back calculation were within ±15% of nominal concentrations. As shown in Table S4, the 16 analytes had good linear relationships (r2 ≥ 0.9960) within the selected linear ranges, and LLOQs ranged from 1.13 to 6.50 ng/mL. The results suggested that the established quantification method met the sensitivity requirements of pharmacokinetic analysis.
3.5.3. Precision and accuracy
Table S5 indicated the 16 analytes’ precision, intra-day, and inter-day accuracy results at multiple levels. The precision (RSD, %) of all analytes at different concentrations was less than 9.29%, and the accuracy (RE, %) ranged from -10.30% to 8.94%. Therefore, the developed approach exhibited acceptable precision and accuracy (RE < ±15% and RSD < 15%).
3.5.4. Matrix effect and extraction recovery
The matrix effects and extraction recoveries of the 16 analytes at HQC, MQC and LQC have been summarized in Table S6. The average recoveries fell between 84.58% and 109.95% (RSDs ≤ 11.03%), which demonstrated stable extraction recoveries (RSDs ≤ 15%). The matrix effects were in the range of 83.86% − 108.36% (RSDs ≤ 10.45%), and no significant matrix effects (RSDs ≤ 15%) were observed.
3.5.5. Stability
The results of the post-extraction, freeze-thaw, short-term stability and long-term stability at HQC, MQC, and LQC have been summarized in Table S7. All analytes possessed acceptable stability (RSDs ≤ 9.92%, -11.87% ≤ RE ≤ 11.73%).
3.6. Application to pharmacokinetic study
The validated approach was then applied to measure the contents of 16 active compounds after administration of LC, SM, or SM-LC. The average plasma concentration-time curves of 16 analytes have been plotted in Figure 8, and the main pharmacokinetic parameters have been shown in Table 2. Pharmacokinetic studies suggested that the ingredients with similar chemical structures possessed analogous pharmacokinetic properties. Compared with the pharmacokinetic parameters of SM-LC in normal rats [22], the pharmacokinetic parameters of SM-LC in MCAO/R rats showed higher Cmax, AUC0-t and AUC0-∞, indicating that the absorption of active compounds in MCAO/R rats was better than that in normal rats. Moreover, most of the active compounds of SM-LC exhibited longer half-life (t1/2) in MCAO/R rats, suggesting that these active ingredients could maintain a relatively higher drug concentration under pathological conditions.
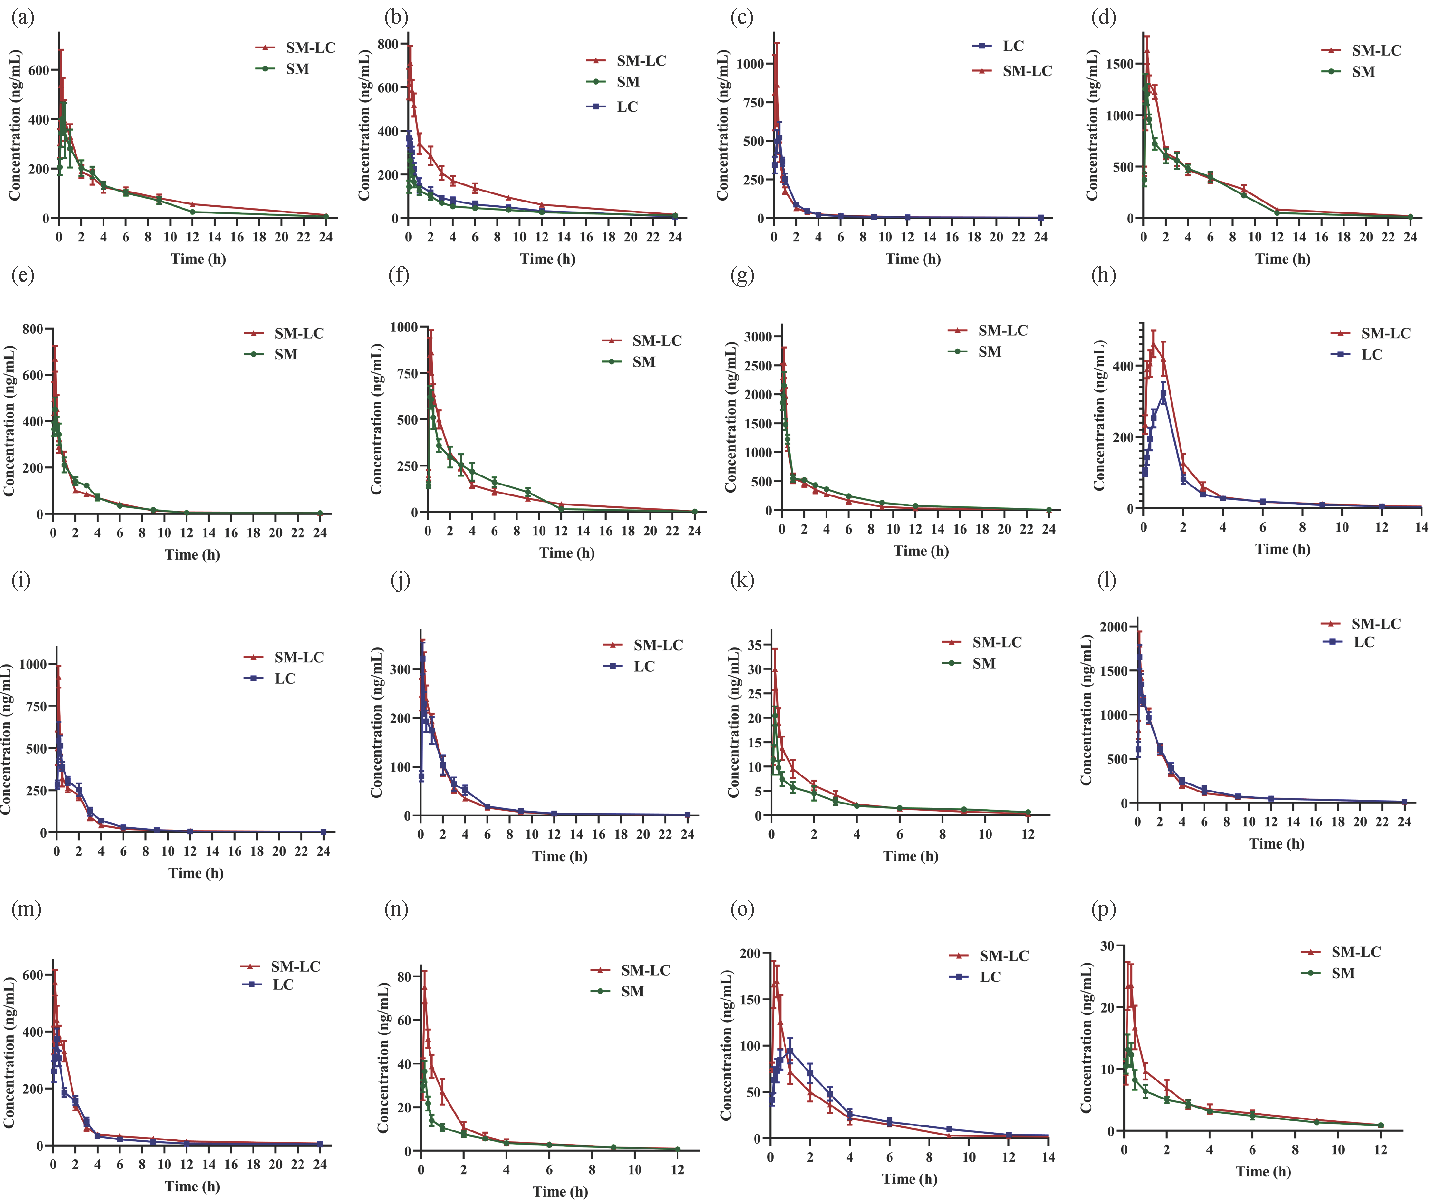
- The mean plasma concentration-time curves of 16 active compounds in rats after oral administration of SM (Salvia miltiorrhiza), LC (Ligusticum chuanxiong) or SM-LC (Salvia miltiorrhiza-Ligusticum chuanxiong) (n = 8). (a) Danshensu; (b) Caffeic acid; (c) Ferulic acid; (d) Lithospermic acid; (e) Rosmarinic acid; (f) Salvianolic acid A; (g) Salvianolic acid B; (h) Senkyunolide I; (i) Senkyunolide A; (j) 3-n-butylphathlide; (k) Dihydrotanshinone I; (l) Ligustilide; (m) Butylidenephthalide; (n) Crytotanshinone; (o) Levistilide A; (p) Tanshinone IIA.
| Analytes | Group | Cmax (mg·mL−1) | Tmax / h | t1/2 / h | MRT0-t / h | AUC0-t (mg·h·mL−1) | AUC0-∞ (mg·h·mL−1) |
|---|---|---|---|---|---|---|---|
| Danshensu | SM | 417.16 ± 84.58 | 0.54 ± 0.19 | 3.95 ± 0.94 | 5.10 ± 0.23 | 1859.07 ± 170.81 | 1894.17 ± 188.74 |
| SM-LC | 575.14 ± 100.16* | 0.29 ± 0.10* | 6.63 ± 2.17* | 6.05 ± 0.42** | 2108.27 ± 244.75 | 2274.15 ± 209.23** | |
| Caffeic acid | SM | 264.46 ± 32.84 | 0.25 ± 0.00 | 9.08 ± 2.07 | 6.70 ± 0.38 | 1005.20 ± 52.31 | 1156.94 ± 83.44 |
| LC | 373.83 ± 24.20 | 0.11 ± 0.07 | 5.83 ± 0.75 | 4.88 ± 1.12 | 1153.70 ± 233.59 | 1328.18 ± 197.36 | |
| SM-LC | 712.13 ± 78.15 | 0.25 ± 0.00 | 5.85 ± 0.90 | 5.72 ± 0.34 | 2648.68 ± 312.92 | 2787.92 ± 379.97 | |
| Ferulic acid | LC | 556.45 ± 77.78 | 0.38 ± 0.14 | 8.25 ± 3.74 | 2.70 ± 0.17 | 817.75 ± 52.13 | 853.57 ± 60.63 |
| SM-LC | 1024.19 ± 212.17** | 0.17 ± 0.09* | 4.98 ± 1.28 | 2.75 ± 0.20 | 847.36 ± 56.92 | 864.87 ± 65.58 | |
| Lithospermic acid | SM | 1277.47 ± 119.19 | 0.33 ± 0.13 | 3.52 ± 0.49 | 3.59 ± 0.80 | 5293.03 ± 335.67 | 5366.32 ± 351.63 |
| SM-LC | 1631.21 ± 135.52** | 0.50 ± 0.00* | 4.33 ± 0.35 | 4.95 ± 0.11* | 6226.34 ± 218.51** | 6348.79 ± 308.87** | |
| Rosmarinic acid | SM | 455.61 ± 44.95 | 0.33 ± 0.13 | 2.12 ± 0.25 | 3.31 ± 0.36 | 1019.03 ± 95.99 | 1035.43 ± 96.35 |
| SM-LC | 669.57 ± 55.76** | 0.25 ± 0.00 | 2.87 ± 1.25 | 3.27 ± 0.33 | 1055.99 ± 36.54 | 1072.76 ± 36.58 | |
| Salvianolic acid A | SM | 650.28 ± 45.51 | 0.38 ± 0.14 | 3.24 ± 0.17 | 4.21 ± 0.18 | 2394.06 ± 231.77 | 2419.12 ± 234.65 |
| SM-LC | 895.48 ± 120.14** | 0.42 ± 0.13 | 3.94 ± 0.50** | 4.32 ± 0.14 | 2508.94 ± 186.27 | 2537.75 ± 185.64 | |
| Salvianolic acid B | SM | 2153.75 ± 230.18 | 0.25 ± 0.00 | 4.22 ± 0.64 | 4.24 ± 0.17 | 4543.08 ± 188.43 | 4609.54 ± 187.20 |
| SM-LC | 2593.46 ± 248.23** | 0.22 ± 0.07 | 3.89 ± 1.03 | 3.11 ± 0.19** | 4122.88 ± 246.02* | 4176.42 ± 231.09** | |
| Senkyunolide I | LC | 323.37 ± 30.23 | 1.00 ± 0.00 | 3.98 ± 1.24 | 2.78 ± 0.56 | 629.55 ± 57.03 | 648.05 ± 50.25 |
| SM-LC | 465.97 ± 33.19** | 0.75 ± 0.16** | 5.82 ± 0.85* | 2.71 ± 0.14 | 973.09 ± 71.58** | 991.72 ± 84.54** | |
| Senkyunolide A | LC | 580.85 ± 99.87 | 0.38 ± 0.13 | 2.79 ± 1.23 | 2.82 ± 0.16 | 1202.57 ± 160.95 | 1236.15 ± 60.36 |
| SM-LC | 923.86 ± 64.42** | 0.25 ± 0.00* | 5.45 ± 2.86 | 2.83 ± 0.34 | 1190.46 ± 54.26 | 1212.18 ± 156.33 | |
| 3-n-butylphathlide | LC | 321.76 ± 32.74 | 0.25 ± 0.00 | 2.79 ± 1.46 | 2.76 ± 0.37 | 632.90 ± 42.69 | 632.90 ± 52.69 |
| SM-LC | 330.73 ± 38.28 | 0.33 ± 0.13 | 3.90 ± 1.96 | 2.68 ± 0.24 | 662.25 ± 76.87 | 666.63 ± 63.69 | |
| Ligustilide | LC | 1653.21 ± 136.37 | 0.25 ± 0.00 | 4.03 ± 1.63 | 3.28 ± 0.63 | 3881.28 ± 372.81 | 4004.89 ± 411.86 |
| SM-LC | 1796.18 ± 145.67 | 0.25 ± 0.00 | 5.53 ± 1.48 | 3.69 ± 0.18 | 3924.23 ± 204.19 | 4019.60 ± 352.52 | |
| Butylidenephthalide | LC | 376.35 ± 35.29 | 0.46 ± 0.10 | 4.39 ± 2.30 | 2.99 ± 0.65 | 818.67 ± 90.38 | 846.60 ± 51.14 |
| SM-LC | 571.80 ± 44.79** | 0.25 ± 0.00** | 8.00 ± 1.99* | 4.03 ± 0.41** | 1159.69 ± 88.19** | 1239.82 ± 89.68** | |
| Dihydrotanshinone I | SM | 20.39 ± 3.94 | 0.25 ± 0.00 | 6.73 ± 1.91 | 3.26 ± 0.27 | 32.44 ± 4.46 | 36.62 ± 5.03 |
| SM-LC | 29.95 ± 4.27** | 0.25 ± 0.00 | 3.18 ± 1.56** | 2.35 ± 0.17** | 41.89 ± 3.62** | 44.91 ± 5.65* | |
| Levistilide A | LC | 96.95 ± 10.72 | 1.13 ± 0.44 | 2.99 ± 1.02 | 3.80 ± 0.39 | 419.18 ± 35.41 | 436.82 ± 31.95 |
| SM-LC | 179.92 ± 13.48** | 0.42 ± 0.20** | 6.57 ± 1.66** | 2.85 ± 0.23** | 367.92 ± 31.38* | 397.48 ± 56.05 | |
| Crytotanshinone | SM | 36.78 ± 4.95 | 0.25 ± 0.00 | 4.23 ± 2.62 | 2.88 ± 0.19 | 58.64 ± 6.93 | 65.42 ± 7.87 |
| SM-LC | 75.15 ± 7.43** | 0.25 ± 0.00 | 3.31 ± 0.70 | 2.19 ± 0.12** | 97.01 ± 14.24** | 101.68 ± 15.41** | |
| Tanshinone IIA | SM | 13.49 ± 2.16 | 0.29 ± 0.10 | 3.81 ± 1.09 | 3.60 ± 0.21 | 38.88 ± 3.09 | 42.96 ± 2.86 |
| SM-LC | 25.08 ± 3.37** | 0.42 ± 0.13 | 4.42 ± 1.57 | 3.22 ± 0.27* | 52.24 ± 4.67** | 58.69 ± 5.94** |
Compared to the single herbs group (SM or LC), * P < 0.05, ** P < 0.01, significantly different. SM: Salvia miltiorrhiza, LC: Ligusticum chuanxiong or SM-LC: Salvia miltiorrhiza-Ligusticum chuanxiong.
3.6.1. Pharmacokinetic properties of phenolic acids in MCAO/R rats
Phenolic acids were the major effective compounds in SM-LC with anti-inflammatory and antioxidant activities [4]. Seven phenolic acids (salvianolic acid A, danshensu, ferulic acid, lithospermic acid, salvianolic acid B, caffeic acid, and rosmarinic acid) were quantified in rat plasma. Their Tmax ranged from 0.11−0.54 hrs, suggesting the rapid absorption of the phenolic acids in the gastrointestinal tract. Salvianolic acid B exhibited the highest Cmax at 2593.46 ng/mL, while lithospermic acid possessed the highest AUC0−∞ and AUC0−t, reaching 6226.34 and 6348.79 mg·h·mL−1, respectively. Compared with SM or LC, the combined administration of SM-LC could obviously enhance the Cmax of rosmarinic acid, salvianolic acid A, danshensu, lithospermic acid, salvianolic acid B, and ferulic acid (P < 0.05), and increase the MRT0−t and AUC0−∞ of danshensu, and lithospermic acid (P < 0.05). However, the Tmax of danshensu and ferulic acid was shorter in the SM-LC group than that in the SM or LC groups (P < 0.05). Under the pathological states, the activities of metabolic enzymes might be activated. Salvianolic acid B had the lower AUC in the SM-LC group, probably because salvianolic acid B was quickly metabolized into other phenolic acids (danshensu, caffeic acid, etc.) by metabolic enzymes or gut flora [30]. According to the pharmacokinetic results, the presence of complicated compounds (phthalides, tanshinones, etc.) in SM-LC might affect the elimination and absorption of phenolic acids [14]. Danshensu, salvianolic acid B, and lithospermic acid had significant antioxidant and antithrombotic effects, thereby treating brain ischemia [1].
3.6.2. Pharmacokinetic properties of phthalides in MCAO/R rats
Phthalides are the characteristic compounds in LC known for various activities, such as neuroprotection, anti-platelet aggregation, and anti-apoptotic effects [3]. Ligustilide, senkyunolide A, senkyunolide I, butylidenephthalide, 3-n-butylphathlide, and levistilide A were quantified in rat plasma. They showed similar MRT0−t (2.68−4.03 h), suggesting slower elimination rates. The AUC and Cmax of ligustilide and senkyunolide A were higher than those of other phthalides, owing to the relatively high contents in SM-LC. Compared to the oral administration of SM or LC, the combined administration of SM-LC significantly increased the Cmax, t1/2, AUC0-t, and AUC0-∞ of senkyunolide I and butylidenephthalide (P < 0.01). However, it significantly decreased Tmax (P < 0.01). Moreover, senkyunolide A and levistilide A showed the higher Cmax and lower Tmax in the SM-LC group. Overall, phthalides possessed relatively higher Cmax, t1/2 and AUC after the combined administration of SM-LC. These results could be partly explained by the fact that some active compounds in SM (phenolic acids and tanshinones) might expedite the absorption and decelerate the elimination of phthalides through regulating the activities of metabolic enzymes [31]. Ligustilide, senkyunolide I and senkyunolide A exerted the significant roles in treating cerebral ischemia by inhibiting neuronal apoptosis and suppressing platelet aggregation [32].
3.6.3. Pharmacokinetic properties of tanshinones in MCAO/R rats
Tanshinones are the major liposoluble compounds in SM with anti-platelet aggregation, vasodilation, and anti-inflammatory activities [19]. In this study, the contents of tanshinone IIA, crytotanshinone, and dihydrotanshinone I, were measured in rat plasma. Due to the low contents of tanshinones in SM, the Cmax and AUC of tanshinones were the lowest compared with other components. Tanshinones showed similar Tmax (0.25−0.42 h) and MRT0-t (2.19−3.60 h), suggesting their rapid absorption in the gastrointestinal tract and quick elimination. The AUC0−t and AUC0−∞, and Cmax of tanshinone IIA, dihydrotanshinone I, and crytotanshinone were higher in the SM-LC group than those in the SM or LC groups (P < 0.05), while their MRT0−t was lower after the combined administration of SM and LC (P < 0.01). Some studies have reported that certain coexisting compounds (phenolic acids and phthalides) in SM-LC could increase the in vivo exposure of tanshinones, which was consistent with our results regarding the pharmacokinetic characteristics of tanshinones [33]. Tanshinones have been demonstrated to possess essential roles in the treatment of cerebral ischemia by inhibiting neuro-inflammation and dilating blood vessels [34].
3.7. Neuroprotective activity evaluation in vitro
To discover the active ingredients of SM-LC against cerebral ischemia, the neuroprotective activities of the prototypes of SM-LC were evaluated on three cell models, including OGD/R-induced injury in HT22, BV2, and BEND.3 cells.
As shown in Figure S6, Figure S7 and Figure S8, the 16 prototypes protected HT22, BEND.3, and BV2 cells from OGD/R-induced injury in a dose-dependent manner. The median effective concentrations (EC50) of the 16 prototypes on OGD/R-induced HT22, BEND.3, and BV2 cells injuries were determined (Table 3). The top five active compounds on OGD/R induced HT22 cells were senkyunolide I, tanshinone IIA, senkyunolide A, dihydrotanshinone I and 3-n-butylphathlide; the first five active compounds on OGD/R induced BEND.3 cells ranked in the following order, danshensu, salvianolic acid B, senkyunolide I, salvianolic acid A, and senkyunolide A; and the first five active ingredients on OGD/R induced BV2 cells were senkyunolide I, crytotanshinone, danshensu, tanshinone IIA, and levistilide A. Overall, the phthalides and tanshinones were better at protecting the HT22 and BV2 cells from OGD/R injury and exerting neuroprotective effects; while phenolic acids were more effective in protecting the BEND.3 cells from OGD/R injury to maintain the blood-brain barrier.
| Group | OGD/R induced HT22 cells injury model | OGD/R induced BEND.3 cells injury model | OGD/R induced BV2 cells injury model | |||
|---|---|---|---|---|---|---|
| EC50 (µM) | 95% CI | EC50 (µM) | 95% CI | EC50 (µM) | 95% CI | |
| Danshensu | 22.658 | 17.421−30.727 | 6.463 | 4.112−8.970 | 18.445 | 14.136−24.162 |
| Caffeic acid | 22.701 | 17.556−29.963 | 87.766 | 66.772−127.802 | 29.225 | 19.062−50.872 |
| Ferulic acid | 49.752 | 39.568−66.101 | 72.200 | 58.818−93.659 | 97.701 | 56.180−268.122 |
| Lithospermic acid | 53.672 | 41.935−73.528 | > 100 | − | > 100 | − |
| Rosmarinic acid | 91.216 | 73.962−120.445 | 79.019 | 62.756−106.932 | > 100 | − |
| Salvianolic acid A | 33.330 | 20.017−51.190 | 20.313 | 16.989−24.389 | 29.955 | 25.412−35.821 |
| Salvianolic acid B | 76.380 | 61.296−101.578 | 14.144 | 10.913−18.042 | 68.608 | 47.572−117.748 |
| Senkyunolide I | 11.577 | 4.232−23.863 | 15.250 | 11.546−19.883 | 14.963 | 10.598−20.770 |
| Senkyunolide A | 11.674 | 7.633-16.591 | 31.619 | 27.076-37.357 | 88.016 | 63.125−141.066 |
| 3-n-butylphathlide | 15.707 | 11.616−20.974 | 58.049 | 41.625−92.888 | 90.138 | 62.905−152.310 |
| Ligustilide | 62.914 | 49.888−84.651 | 47.900 | 38.664−62.173 | 24.545 | 18.882−32.858 |
| Butylidenephthalide | 44.825 | 35.772−59.015 | 93.183 | 63.398−127.707 | 57.852 | 45.375−78.846 |
| Dihydrotanshinone I | 22.206 | 16.927−36.168 | 44.887 | 34.854−64.307 | > 100 | − |
| Levistilide A | 23.739 | 18.063−32.094 | 91.151 | 71.256−130.182 | 23.651 | 17.443−33.039 |
| Crytotanshinone | 31.764 | 16.559−48.478 | > 100 | − | 18.365 | 8.404−42.232 |
| Tanshinone IIA | 16.124 | 3.832-29.179 | 35.882 | 25.630-60.589 | 20.047 | 14.049−29.220 |
CI: Confidence interval
4. Conclusions
In this work, the UHPLC-QTOF-MS approach was utilized to characterize the metabolic profiles in rat biological samples after oral administration of SM-LC. We identified 154 chemical compounds, including 33 prototypes and 121 metabolites Afterward, the validated UHPLC-QQQ-MS approach was established to conduct the comparative pharmacokinetic study. The pharmacokinetic results suggested that SM-LC could promote the absorption and delay the elimination rates of some active compounds (danshensu, lithospermic acid, senkyunolide I, etc.). Further neuroprotection evaluation showed that these prototypes exhibited significant neuroprotective effects in dose-dependent manners. In summary, our study would help to reveal the active ingredients of SM-LC and provide valuable information for the mechanism’s research on this herb pair against cerebral ischemia.
Acknowlegment
National Natural Science Foundation of China (No. 822044593), China Postdoctoral Science Foundation (2024M752727), as well as Jiangsu Province Graduate Research and Practical Innovation Plan (SJCX24_2328).
CRediT authorship contribution statement
Han-Qing Pang: Supervision, validation, conceptualization, funding acquisition, writing − editing. Xuan-Hao Zhang: Metabolic profiling, activity evaluation, Writing − original draft. Jia-Xiu Guo: Investigation, validation, writing − original draft. Ying Li: Investigation, validation. Yong-Juan Zhao: Investigation, writing − original draft. Yang-Peng Yan: activity evaluation. Bing-Chun Yan: Funding acquisition, resources, writing − editing.
Declaration of competing interest
The authors declare that they have no known competing financial interests or personal relationships that could have appeared to influence the work reported in this paper.
Declaration of Generative AI and AI-assisted technologies in the writing process
The authors confirm that there was no use of artificial intelligence (AI)-assisted technology for assisting in the writing or editing of the manuscript and no images were manipulated using AI.
Supplementary data
Supplementary material to this article can be found online at https://dx.doi.org/10.25259/AJC_321_2024.
References
- Uncovering chemical interactions between danshen and danggui using liquid chromatography–Mass spectrometry and network pharmacology-based research on stroke. World Journal of Traditional Chinese Medicine. 2024;10:230-243. https://doi.org/10.4103/wjtcm.wjtcm_45_23
- [Google Scholar]
- The protective effect of an extract of salvia miltiorrhiza bunge (Danshen) on cerebral ischemic injury in animal models: A systematic review and meta-analysis. Journal of Ethnopharmacology. 2023;317:116772. https://doi.org/10.1016/j.jep.2023.116772
- [CrossRef] [PubMed] [Google Scholar]
- Research advances in cardio-cerebrovascular diseases of ligusticum chuanxiong hort. Frontiers in Pharmacology. 2022;12:832673. https://doi.org/10.3389/fphar.2021.832673
- [CrossRef] [PubMed] [PubMed Central] [Google Scholar]
- Elucidating the chemical interaction effects of herb pair SM-LC and its anti-ischemic stroke activities evaluation. Journal of Ethnopharmacology. 2024b;318:117058. https://doi.org/10.1016/j.jep.2023.117058
- [CrossRef] [PubMed] [Google Scholar]
- Screening of potential thrombin and factor Xa inhibitors from the SM-LC herbal pair through a spectrum-effect relationship analysis. Molecules. 2021;26:7293. https://doi.org/10.3390/molecules26237293
- [CrossRef] [PubMed] [PubMed Central] [Google Scholar]
- Network pharmacology-based approach uncovers the mechanism of guanXinNing tablet for treating thrombus by MAPKs signal pathway. Frontiers in Pharmacology. 2020;11:652. https://doi.org/10.3389/fphar.2020.00652
- [CrossRef] [PubMed] [PubMed Central] [Google Scholar]
- Pharmacokinetics of four phenolic acids from SM-LC drug pair in plasma and heart tissue of rats by UPLC-MS/MS. China Journal of Chinese Materia Medica. 2019;44:4257-4262. https://doi.org/10.19540/j.cnki.cjcmm.20190619.203
- [CrossRef] [PubMed] [Google Scholar]
- Integrated spatial metabolomics and network pharmacology to explore the pharmacodynamic substances and mechanism of Radix ginseng-Schisandra chinensis Herb Couple on Alzheimer’s disease. Analytical and Bioanalytical Chemistry. 2024;416:4275-4288. https://doi.org/10.1007/s00216-024-05364-z
- [CrossRef] [PubMed] [PubMed Central] [Google Scholar]
- Cytochrome P450 and other drug-metabolizing enzymes as therapeutic targets. Drug Metabolism and Disposition. 2023;51:936-949. https://doi.org/10.1124/dmd.122.001011
- [CrossRef] [PubMed] [Google Scholar]
- Selective control of parasitic nematodes using bioactivated nematicides. Nature. 2023;618:102-9. https://doi.org/10.1038/s41586-023-06105-5
- [CrossRef] [PubMed] [PubMed Central] [Google Scholar]
- Comprehensive chemical profiling of yindan xinnaotong soft capsule and its neuroprotective activity evaluation in vitro. Journal of Chromatography A. 2019;1601:288-299. https://doi.org/10.1016/j.chroma.2019.05.023
- [CrossRef] [PubMed] [Google Scholar]
- Comprehensive characterization of epimedium-rhizoma drynariae herb pair in rat plasma, urine, and feces metabolic profiles by UHPLC-q-orbitrap HRMS combined with diagnostic extraction strategy and multicomponent pharmacokinetic study by UHPLC-MS/MS. Analytical and Bioanalytical Chemistry. 2024;416:3415-3432. https://doi.org/10.1007/s00216-024-05292-y
- [CrossRef] [PubMed] [PubMed Central] [Google Scholar]
- Referenced kendrick mass defect annotation and class-based filtering of imaging MS lipidomics experiments. Analytical Chemistry. 2022;94:5504-5513. https://doi.org/10.1021/acs.analchem.1c03715
- [CrossRef] [PubMed] [PubMed Central] [Google Scholar]
- A mass defect filtering combined background subtraction strategy for rapid screening and identification of metabolites in rat plasma after oral administration of yindan xinnaotong soft capsule. Journal of Pharmaceutical and Biomedical Analysis. 2023;231:115400. https://doi.org/10.1016/j.jpba.2023.115400
- [CrossRef] [PubMed] [Google Scholar]
- Identification of xenobiotic biotransformation products using mass spectrometry-based metabolomics integrated with a structural elucidation strategy by assembling fragment signatures. Analytical Chemistry. 2023;95:14279-14287. https://doi.org/10.1021/acs.analchem.3c02419
- [CrossRef] [PubMed] [PubMed Central] [Google Scholar]
- A strategy of accuracy quantification by extending the concentration monitoring coverage based on online double collision energy of ultra-high performance liquid chromatography tandem mass spectrometry: The pharmacokinetics of toddalia asiatica as a case study. Journal of Chromatography A. 2024;1716:464634. https://doi.org/10.1016/j.chroma.2024.464634
- [CrossRef] [PubMed] [Google Scholar]
- Naoxintong capsules exhibited a protective effect against cerebral ischemia in the brain hub region of MCAO rats via intervention of amino acid metabolism. Arabian Journal of Chemistry. 2024;17:105659. https://doi.org/10.1016/j.arabjc.2024.105659
- [CrossRef] [Google Scholar]
- Tanshinone IIA as a therapy for PCOS via FOS/JUN/TP53 axis: Evidence from network pharmacology of bajitian-danshen pair. Arabian Journal of Chemistry. 2024;17:105641. https://doi.org/10.1016/j.arabjc.2024.105641
- [CrossRef] [Google Scholar]
- The in vivo absorbed constituents and metabolites of Danshen decoction in rats identified by HPLC with electrospray ionization tandem ion trap and time-of-flight mass spectrometry. Biomedical Chromatography. 2015;29:285-304. https://doi.org/10.1002/bmc.3275
- [CrossRef] [PubMed] [Google Scholar]
- Metabolite identification of salvianolic acid A in rat using post collision-induced dissociation energy-resolved mass spectrometry. Chinese Medicine. 2024;19:64. https://doi.org/10.1186/s13020-024-00931-z
- [CrossRef] [PubMed] [PubMed Central] [Google Scholar]
- A structural similarity networking assisted collision cross-section prediction interval filtering strategy for multi-compound identification of complex matrix by ion-mobility mass spectrometry. Analytica Chimica Acta. 2023;1278:341720. https://doi.org/10.1016/j.aca.2023.341720
- [CrossRef] [PubMed] [Google Scholar]
- Comparative profiling of the absorbed compounds and metabolites, and pharmacokinetic studies of danshen-chuanxiong herb pair in rat plasma and brain using liquid chromatography-tandem mass spectrometry. Journal of Pharmaceutical and Biomedical Analysis. 2025;252:116519. https://doi.org/10.1016/j.jpba.2024.116519
- [CrossRef] [PubMed] [Google Scholar]
- An image-based fingerprint-efficacy screening strategy for uncovering active compounds with interactive effects in yindan xinnaotong soft capsule. Phytomedicine. 2022;96:153911. https://doi.org/10.1016/j.phymed.2021.153911
- [CrossRef] [PubMed] [Google Scholar]
- Material basis and integrative pharmacology of danshen decoction in the treatment of cardiovascular diseases. Phytomedicine. 2023;108:154503. https://doi.org/10.1016/j.phymed.2022.154503
- [CrossRef] [PubMed] [Google Scholar]
- Identification of the absorbed components and metabolites in rat plasma after oral administration of Rhizoma Chuanxiong decoction by HPLC-ESI-MS/MS. Journal of Pharmaceutical and Biomedical Analysis. 2011;56:1046-1056. https://doi.org/10.1016/j.jpba.2011.08.010
- [CrossRef] [PubMed] [Google Scholar]
- Metabolomic profiling integrated with molecular exploring delineates the action of ligusticum chuanxiong hort. on migraine. Phytomedicine. 2024;134:155977. https://doi.org/10.1016/j.phymed.2024.155977
- [CrossRef] [Google Scholar]
- Screening of anti-thrombin active components from Ligusticum chuanxiong by affinity-ultrafiltration coupled with HPLC-Q-Orbitrap-MSn. Phytochemical Analysis. 2023b;34:443-452. https://doi.org/10.1002/pca.3225
- [CrossRef] [PubMed] [Google Scholar]
- In vivo metabolites and plasma exposure of tongMai keli analyzed by UHPLC/DAD/qTOF-MS and LC/MS/MS. Journal of Ethnopharmacology. 2013;145:509-516. https://doi.org/10.1016/j.jep.2012.11.021
- [CrossRef] [PubMed] [Google Scholar]
- LC-MS-based multivariate statistical analysis for the screening of potential thrombin/factor Xa inhibitors from Radix Salvia Miltiorrhiza. Chinese Medicine. 2020;15:38. https://doi.org/10.1186/s13020-020-00320-2
- [CrossRef] [PubMed] [PubMed Central] [Google Scholar]
- The identification and pharmacokinetic studies of metabolites of salvianolic acid B after intravenous administration in rats. Chinese Journal of Natural Medicines. 2013;11:560-5. https://doi.org/10.3724/sp.j.1009.2013.00560
- [CrossRef] [PubMed] [Google Scholar]
- Identification of Senkyunolide I as a novel modulator of hepatic steatosis and PPARα signaling in zebrafish and hamster models. Journal of Ethnopharmacology. 2025;336:118743. https://doi.org/10.1016/j.jep.2024.118743
- [CrossRef] [PubMed] [Google Scholar]
- The study of different markers among chuanxiong chatiao dosage forms based on bioactive components and antiplatelet aggregation biopotency integrated with chemometrics. Arabian Journal of Chemistry. 2024;17:105421. https://doi.org/10.1016/j.arabjc.2023.105421
- [CrossRef] [Google Scholar]
- A sensitive LC-MS/MS method-based pharmacokinetic study of fifteen active ingredients of yindan xinnaotong soft capsule in rats and its potential mechanism in the treatment of cardiovascular diseases. Journal of Chromatography B. 2023;1220:123663. https://doi.org/10.1016/j.jchromb.2023.123663
- [CrossRef] [Google Scholar]
- New insights of advanced biotechnological engineering strategies for tanshinone biosynthesis in salvia miltiorrhiza. Plant Science. 2025;352:112384. https://doi.org/10.1016/j.plantsci.2025.112384
- [CrossRef] [PubMed] [Google Scholar]


